
by applying subjective identification techniques on Streamline Chart at the start of Rainfall recorded in 1966-2012 at Hong Kong, with verification over an outside sample dataset in the 2013-2021 period
Charles Luk
Highlights:
22 January 2025- the synoptic model’s final work is to focus on stormy weather-borne synoptic features anticyclones rather than behavior types: A) A new synoptic feature on continental ridge, a particular form of anticyclone, is discussed in Cat 2.5, B) A new opening paragraph is added to the Section on Category 3 behavior to elaborate on situations when anticyclones at 200hPa impacts Hong Kong’s weather, and C) The CLOSE Section is now dedicated to the discussion on a special class of anticyclones – the “standalone anticyclone”. Lastly, D) Cat 3 presents how a slow synoptic situation at the surface produces a temporary relief(break) within a spell of heavy rainstorm.
For a busy reader, a first-time viewer, or a site visitor from another subtropical region, a quick run-over can be done on the “Abstracts”, the “Synoptic Event” section, the “Presentation” section which contains all the 13 spell cases (skipping the non-spell cases except a behavior’s recurrence from a lately occurrence case at Category 3 Case 8, and the most extraordinary case at Category 3 Case 8a), the “Conclusion” section, skipping the “Verification” section and jump to the “Closing” section.
Other updates:
31st January 2025: A remark is added on the fourth paragraph of the Verification Section.
25th January 2025 Cat 3 Case 4(spell): The behavior of a most remarkable mid-latitude trough passage is re-defined a second time.
13th November 2024: Cat 1 Case 2 is relocated and refined to form Cat 3 Case 8a, and Cat 3 Case3a is relocated and redefined to form Cat 1 Case 2.
9th November 2024:Refine behavior for Cat2 Case2.
18th and 22nd October 2024: Refine behavior for Cat1 Case 2, Cat 3 Case 3b(spell), Cat 3 Case 4(spell), and the most dramatic case at the end of the CLOSE Section.
28st September 2024: (1) Addition of an illustrative example for Cat 3 Case 3, (2) addition of a typical case on behavior exhibited by those ridge cells on own row (refer: Situation Example 1 at the start of the VERIFICATION section), and (3) redefinition of a very common behavior exhibited by long horizontal ridge or large ridge cell on own row illustrated with a chart-example pair (refer: Cat 2 Case 1 ).
28th July 2024 : (1) Re-definition of behavior on easterly wave formation in Cat 1 Case 4a. , and (2) introduction of behavior on easterly wave-like perturbation formation in Cat 3 Case 3b(spell) and Example 4(near end of document).
10th January 2021- First posting.
ABSTRACTS
Observations show that each occurrence of 12-hourly extreme rainfall in Hong Kong is directly related to the synoptic features which appear on the 200 hPa chart at the start of the 12 hours. Successive occurrences over 24 hours form an extreme rainfall spell under one synoptic situation dominated by a disturbance affecting Hong Kong.
INTRODUCTION : An upper-air disturbance detection Model is formulated from 200 hPa synoptic developments observed on the latest 2 streamline charts preceding every heavy rainstorm case in 1966-2012 in Hong Kong. An attempt is made to generalize the concept of the techniques in the model for other subtropical regions. Rainstorm extremes are defined as any occurrence of 12-hourly rainfall amounts of 80 mm measured at H+12 up to a maximum of approximately 300 mm and above. The approach is through systematic identification and classification of activities or events (hereafter called behavior) observed from two latest streamline charts at H -12 and H -0 preceding storms. The NCEP/NCAR Annual Reanalysis Dataset of the National Weather Service forms the base of data in this study which is conducted by a VC++ software program running on the Microsoft Windows 10 platform.
This document presents a sample from 29 observations each with a separate 200 hPa behavior pattern involving storm occurrence (ranging between 83.0mm and 295.7mm with a mean of 184.9 mm). There are 37 real behavior types (plus 2 from virtual behavior mentioned below) and 210 cases in the 47 years. The 29 behavior types though constitute only 78% in types, encompass 189 observations which constitute 90% of the total occurrences (in other words, with the remaining 12 behavior types accounting for 21 observations). The 29 cases with 6 at the top of the intensity list and 7 others comprise 13 (with mean = 229.9mm) out of a total of 17 historical cases which are greater or equal to 200mm.
As a word of caution, since surface synoptic features such as tropical cyclones and easterly waves can play a role in modulating certain types of upper-air behavior, the resulting behavior types could therefore be specific to the regions in which these features can prevail. In such circumstances, each meteorological office should develop own model suitable for its region.
The next question is how big a historical dataset of behavior is considered large enough to meet one’s performance expectation. Although no dataset is complete and exhaustive of all behavior, if throughout a long (say 50 years) record period, there is no behavior entry occurred just once (meaning a match from the pool of observed behavior is always found for each entry), one can be fairly confident that the behavior dataset is highly ‘self-contained’. But strictly speaking, this is not a reasonable requirement as long as each unique behavior occurrence is dynamically justified. In building the detection model from historical records, we have to assign for each rainstorm occurrence a behavior type observed on the 200 hPa analysis. If no behavior type that can best (meaning concisely, precisely, and completely) describe the dynamic of the situation exists, one can either expand the definition on some existing behavior type or define a new type. It is critical for behavior type to be defined correctly to avoid 1) introduction of fake behavior type into the model due to misperception or misinterpretation of the situation and 2) collateral damage which compromises the addition of a new proper type into the model. Sometimes, a situation can meet criteria of more than one type of behavior, precedence should be given to assigning the type as one which is historically most weather destructive among types.
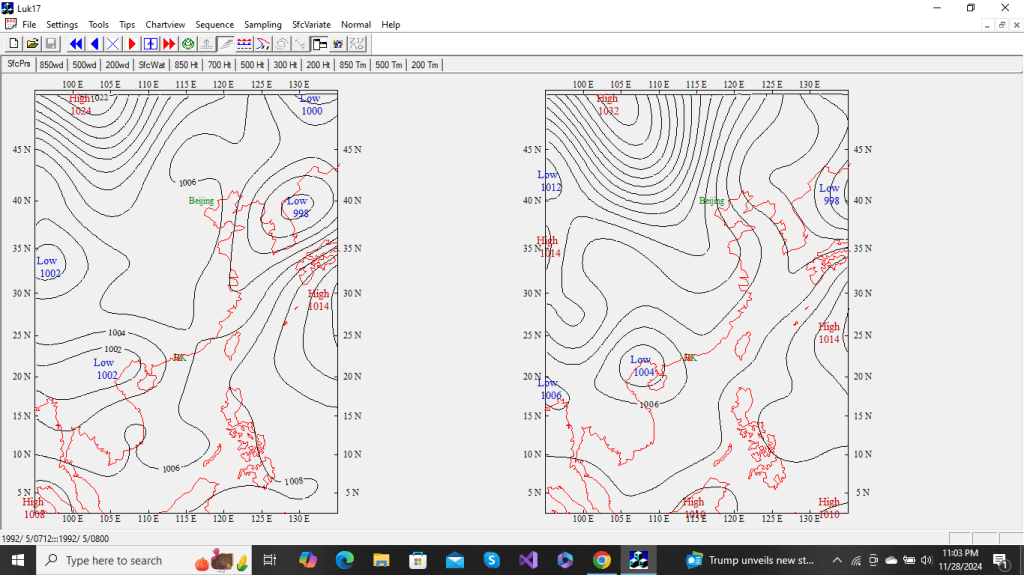
The following descriptions and charts contain examples of behavior with detection guidelines used to uncover them. The chart time at the top refers to the right-hand chart at Hour +0. The rainfall amount at Hours +12 is displayed at the top line of each pair of charts. (for reference, the left-hand chart time at Hour -12 is displayed at the bottom left corner inside the chart). Readers are encouraged to practice behavior assignment before advancing the baseline of the chart beyond the bottom edge of the browse screen to read the type description there.
Each case listed below carries a case number. If in some case (actually 4) the case number has the letter ‘a’ subscript, it means that it is a variation from the non-subscript case (both of which apply to the same meteorological feature) with rarer occurrence but worse weather consequence.
ANALYSIS From records, rainstorms not preceded by behavior type on 200 hPa analysis could happen for a handful of cases, suggesting that behavior type is not a necessary condition. But research shows under these situations, each case would exhibit either one of the 2 aspects of vertical velocity activity at 850 hPa level. By regarding such phenomena as virtual behavior, we can declare behavior (either real or virtual) to be a necessary condition for extreme rainstorm occurrence. On the other hand, past statistics show not all behavior occurrences at 200 hPa were succeeded by heavy rainstorm, behavior is therefore not a sufficient condition. What can we do, in future practice, to trust any observed behavior could eventually turn up sufficient? Instability evidence on the surface pressure chart from each past rainstorm record is what we can resort to. In the first place, none of the 210 storms was associated with stable surface situation. Unstable surface situations amount to 168 (80%) and can be used as a good suggestion to support behavior found on 200 hPa. For the remaining 20%, where the surface chart shows only mild or even neutral condition (e.g. slack trough or flabby/stationary low or trough/low absent in proximity) which are not favorable for heavy rainstorm development, supporting evidence has to be sought from the 850 hPa level. In the presentation follows, depending on where greater instability observed, either the surface or 850 hPa chart at the date-time of the behavior case could be selected in the display.
SYNOPTIC EVENTS Disturbance can last over multiple (up to 3) 12-hourly periods in a rain spell. In the following, whenever any presented behavior type falls within a spell, all preceding or succeeding types occurring in that spell are included in the display. The 175 rainstorms lasting 1, 2, or 3 periods are composed of 147(84%) single period cases, 21(12%) double period cases, and 7(4%) triple period cases (which add up to 147+21X2+7X3= 210 period cases). This document includes 8 of the 21 double-period spells and 4 of the 7 triple-period spells with the most remarkable rain-bearing behavior type dated and referred to as the ‘featured’ type. In the study of a spell, instead of just listing it in a series of unrelated, discrete, and standalone behavioral occurrences, walking over each spell on an eventful scenario will shed light on the synoptic perspective involved. In short, an event is a composition of atmospheric activities from behavior combined.
Following are 3 example events. The first event is the formation of an atmospheric feature (e.g. easterly wave) appearing under one of the three situations: 1) A feature is formed at a great distance from Hong and takes a long time to complete its approach. 2) the feature that forms in the vicinity might show a rudimentary stage which lengthens its time of weather impact on the station, and 3) the feature that occurs with great intensity or size extends its subsequent evolution in degeneration or further development to a new feature. The second event is that an atmospheric process may persist for a long time or accompany further development. The last(third) event is atmospheric features(such as trough and anticyclone) may take a long while to finish their interaction. For example, an anticyclone expands against a cyclonic or easterly wave to its south for a long duration or a westerly trough takes a long distance to complete its passage. A slow travelling trough across the East China coast may trigger a prolonged anticyclonic expansion over Hong Kong. In other words, activities occurring in a spell can be combined as one single synoptic event of feature(easterly wave) birth, feature(ridge) evolution or feature movement ( trough passage). Synoptic event descriptions will be stated in a tagline at the start of each ‘spell’ case.
PRESENTATION Behavior types are classified under 3 categories. The first category (roughly 23% with a mean of 136.7mm) can be called the ‘what’ category because each behavior type can be easily identified from familiar/well-known meteorological feature objects observed on streamline charts. These include various waves in the easterly (such as large vertical wave, easterly wave, and tilted easterly wave), horizontal-axis trough, and strong out flowing anticyclone or large/small cyclone.
The focus is on the searching of all these features as well as determination of their genesis, locations relative to the station, tracks/movements, intensity, transformation to or interaction with other features within the same category. Behavior which ‘brought about’ extreme rainfall mostly came from behavior types in this category.
Category one behavior All cases in Category 1 occur at the height of summer months (August and September) in association with passage of severe/extreme Tropical Cyclone the occurrence of which in Hong Kong are confined to Category 1 in this study.
Cat 1 Case 1: 182mm – 97082200
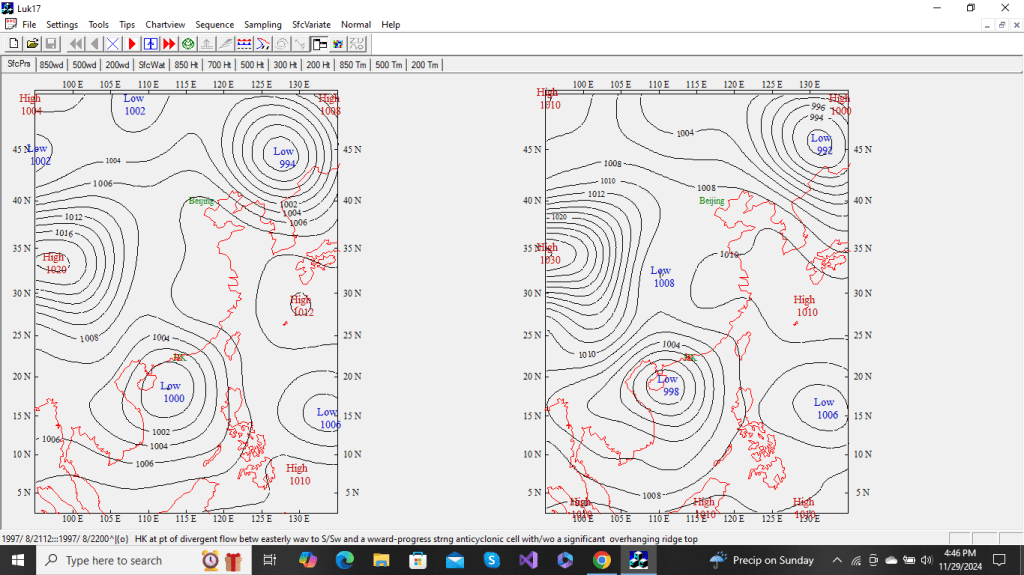
1.1: tropical cyclone passage
(Also referred in 1.4)HK at point of divergent flow between easterly wave to S/SW and a westward-passage strong anti-cyclonic cell with/without a significant overhanging ridge top.
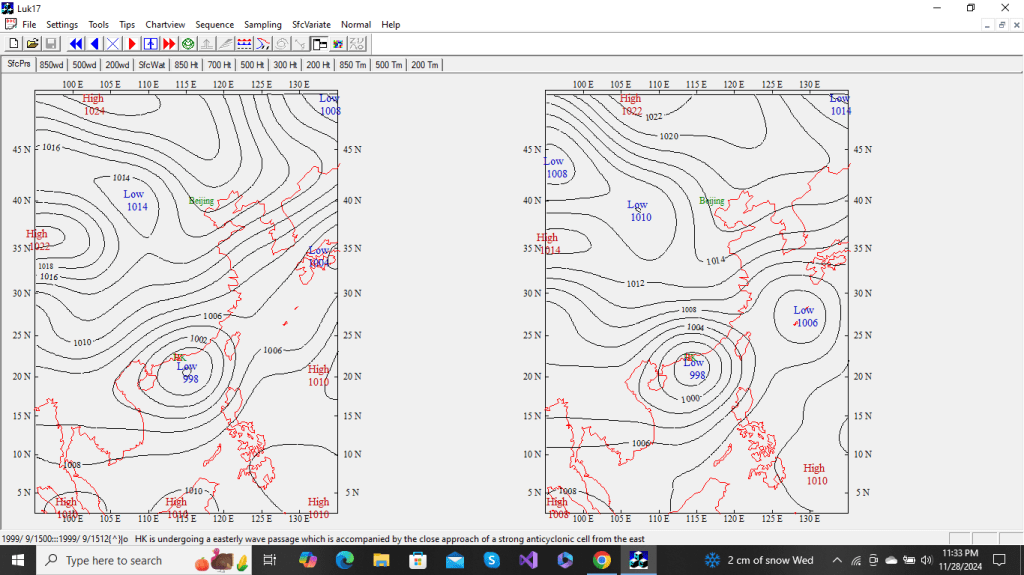
Cat 1 Case 2: (relocated and redefined form Cat 3 Case 3a) 201.7mm – 79080200

1.2 : tropical cyclone passage

HK is undergoing an easterly wave passage ahead of a vertical ridge in close or distant approach from north-eastern part of the South China Sea.
Cat 1 Case 3: 09091412 – 146.7mm

1.3: tropical cyclone passage
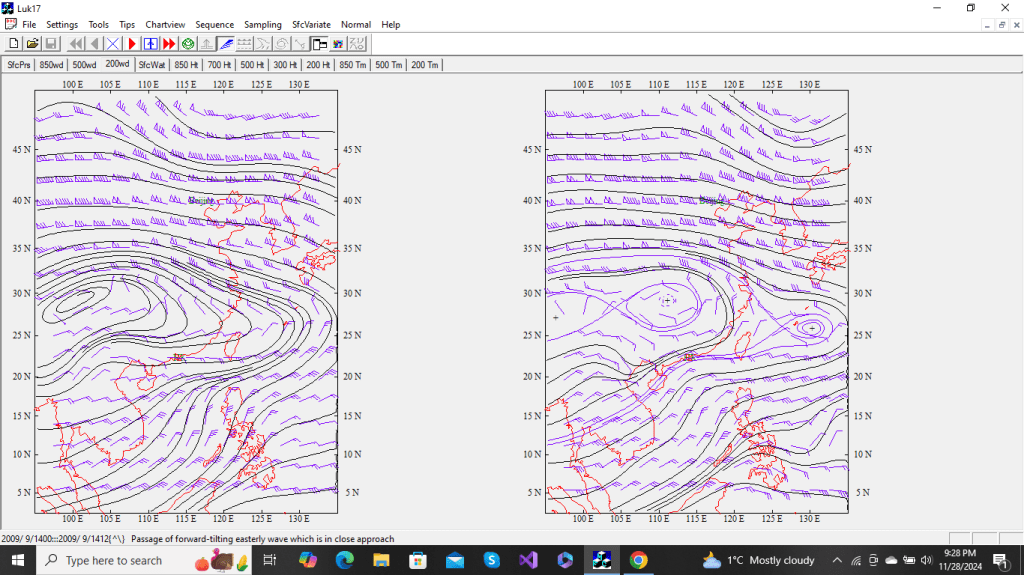
Passage of forward-tilting easterly wave which is in close approach
The next 2 cases relate to easterly waves:
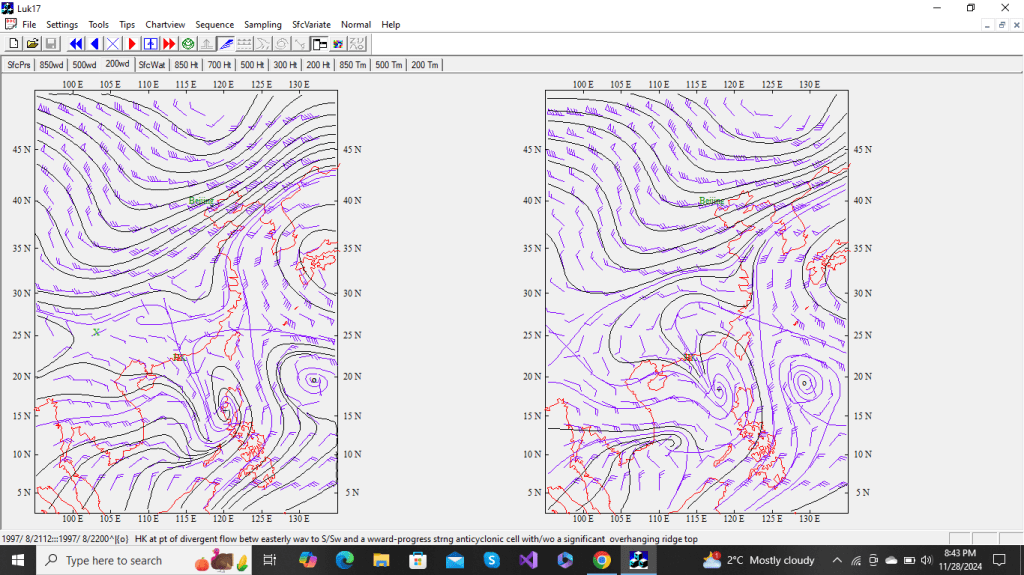
Cat 1 Case 4(spell)
1.4: tropical cyclone passage
Synopsis – formation of distant easterly wave :
(162.6mm) 99091512

—————————————-right:-HK is undergoing an easterly wave passage accompanied closely behind by a strong anti-cyclonic cell.
(88.3mm)
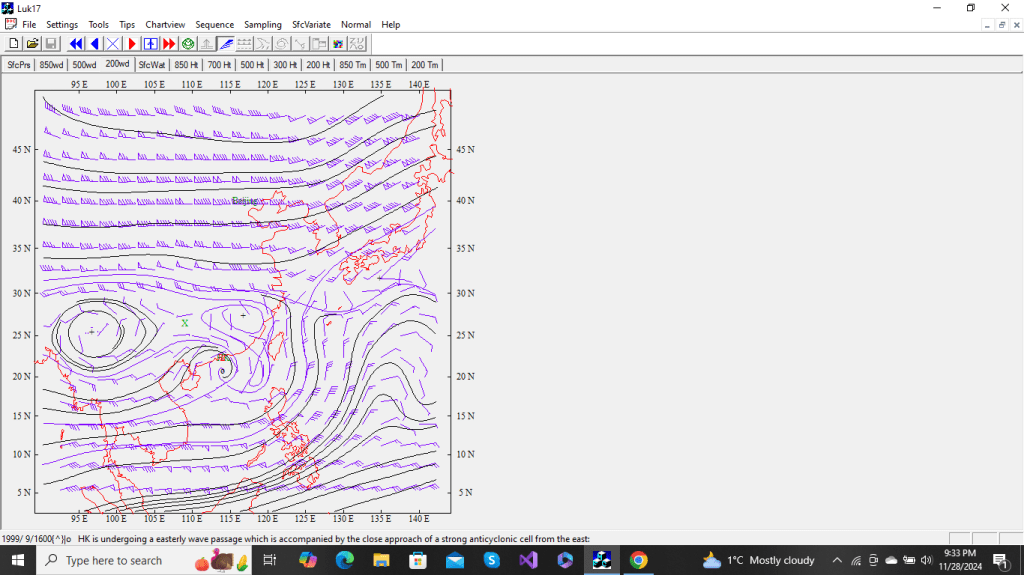
Continuation of the behaviour described above. End of spell
Cat1 Case 4a (spell)
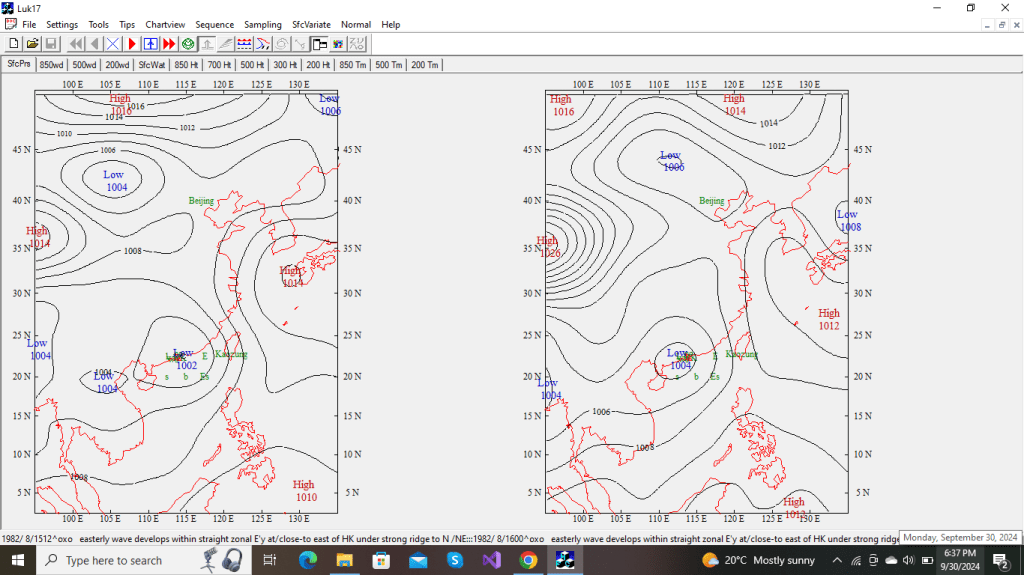
1.4a: tropical cyclone passage
Synopsis – formation of slow-growing easterly wave :
(139.8mm) (220mm) 82081600

Both sides:- Close to the east of HK within a steady easterly flow under a strong continental anticyclone to north, easterly wave perturbation develops. A necessary feature is that the strong ridge should extend from behind the wave crest northeastward to central China.
The next 2 cases relate to outflowing cyclone:
Cat 1 Case 5(spell)
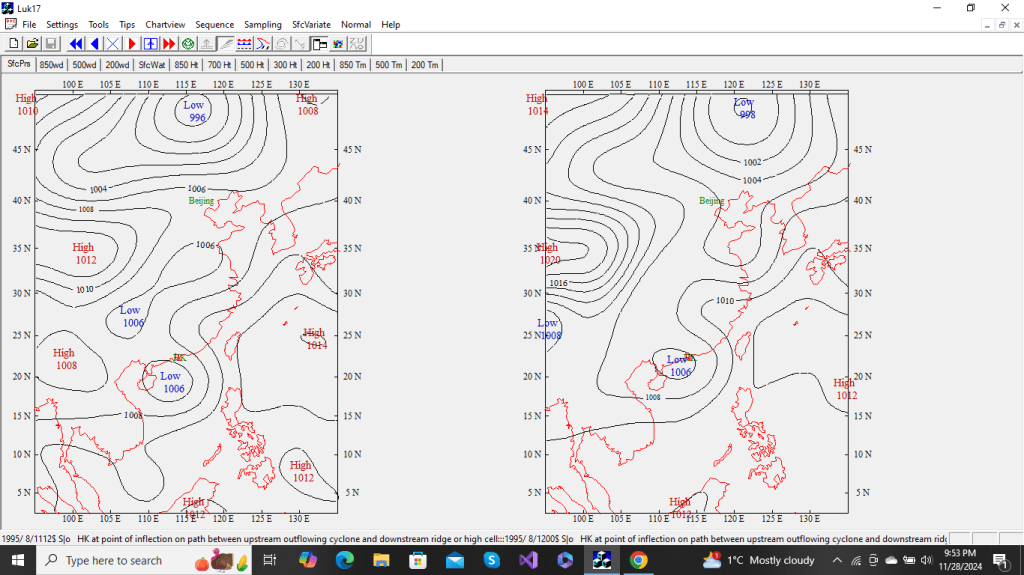
1.5: tropical cyclone passage
Synopsis – Degeneration of a large downstream-curvature-reversing outflowing cyclone followed by its further ‘degeneration’ to a ridge :
(90.2mm)
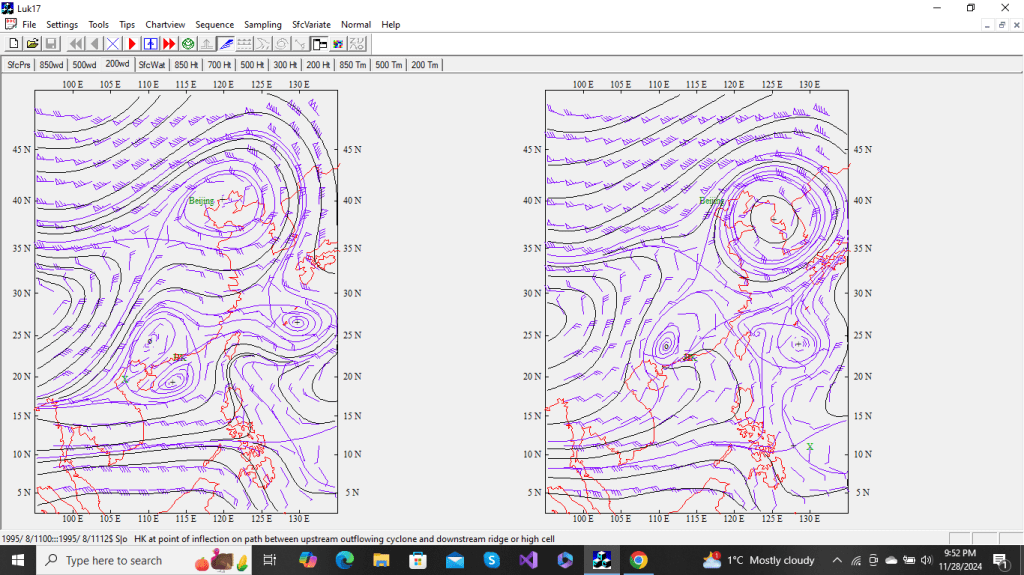
—————————————-right:-HK at point of inflection on path between upstream out-flowing cyclone and downstream ridge or high cell.
(128.8mm) 95081200 (144.9mm)
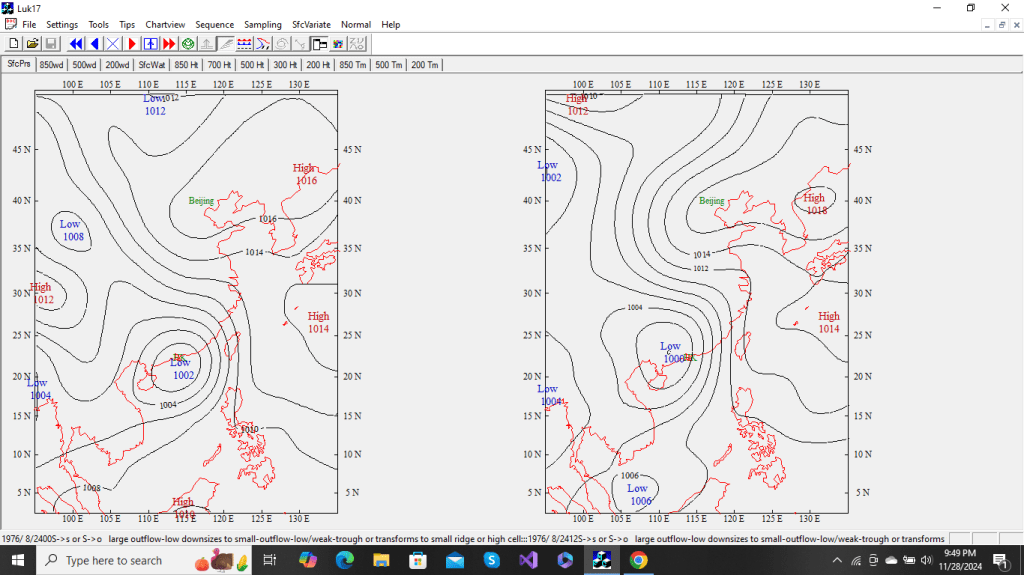
left:-same as the last behavior—–right:-(referring case 1.5a) large outflow-low may become weaken(downsize) to small outflow-low, weak trough, small ridge or high cell depending on severity in the extent of ‘upward’ transformation. End of spell.
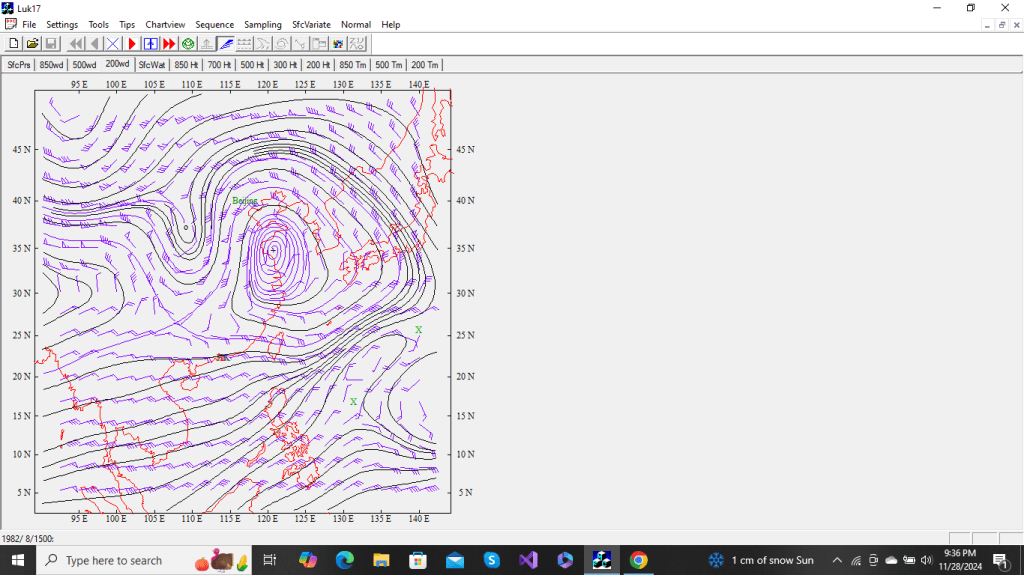
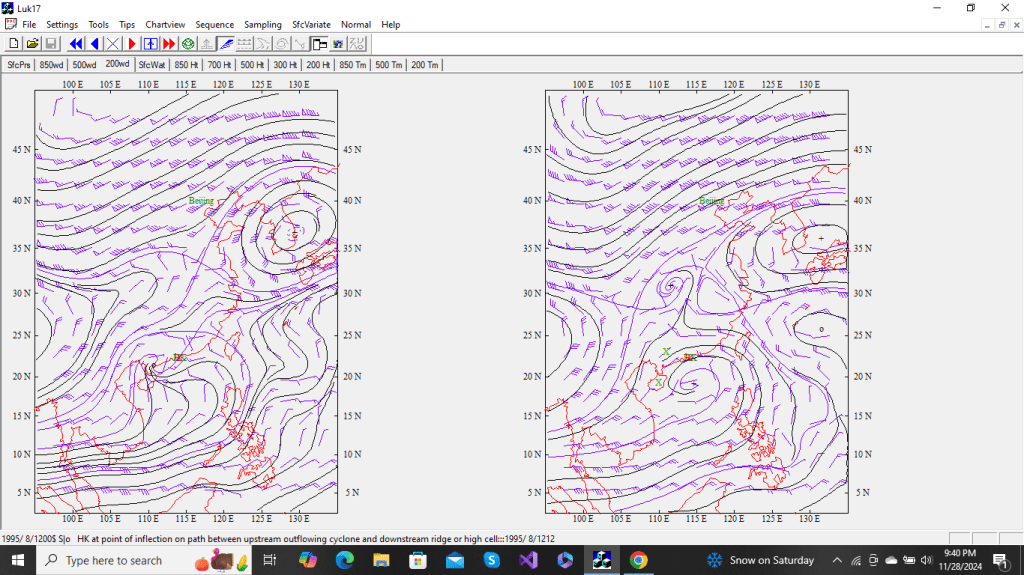
Cat 1 Case 5a (spell)
1.5a: tropical cyclone passage
Synopsis – Degeneration of large outflowing cyclone and its transformation to a horizontal trough :
(92mm)
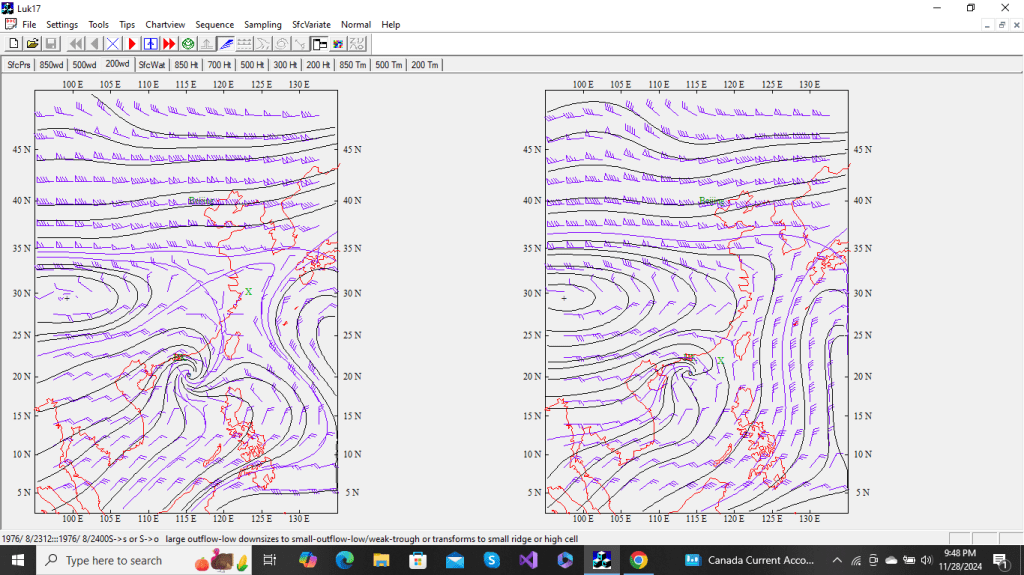
————————————-right:- (the case is referenced in Case 1.5) large outflow-low can weaken(downsize) to small outflow-low, weak trough, small ridge or high cell depending on severity in the extent of ‘upward’ transformation.
(274.7mm) 76082412 (92.2mm)

Left:-same as the last behavior, right:-(supplementary) horizontal wave passage as front edge of a flat top wave reaching HK from east or as horizontal trough 1)close to N or 2) far away to east as seen just passing Taiwan. End of spell
Category two behavior The behavior types in the second category which constitutes a very significant part (roughly 41%) of HK’s past extreme weather situations could be called the ‘where’ category because they are easily located from a) horizontal/tilted ridge resting on own/adjacent 2&1/2 degree latitude band (row) near HK or b) southwest China’s semi-rhombus-shaped ridge anchored to the west of HK. Each type is involved with the south-to-own or north-to-own row displacement or vice versa happening to a ridge segment on the east, west or both sides of Hong Kong. A common observation is through using a ridge axis clockwise or counterclockwise rotation. Such rotation is hinged on a pivotal ridge or anticyclone center in a specific neighborhood and would end up with the axis closer to or further away from Hong Kong. Observations also include tilting as applied to ridge cell hinged near Hong Kong extending east-northeast, with winds veering along the top line as they get further away from Hong Kong. Other observations include dipping as applied to ridge hinged west-northwest of Hong Kong extending to Hong Kong.
Since in some cases, the qualifying ridge mentioned above could match more than one behavior type description, it is advisable to determine type in the following order of precedence: 1) having cyclonic upstream flow (allocating it as a type in the first category), 2) ridge-axis row-position shift occurring in semi-rhombus shaped standing ridge, 3) making row displacement by a segment on either side of HK, 4) exhibiting close/distant axis tilting or dipping, and 5) ridge width shrinking (i.e. wind barbs undergoing angle sharpening alongside ridge axis) on north/own row. Behavior type belonging to this category also includes northeast/southwest ridge extension/intrusion to HK from medium-sized anticyclone to the southwest/northeast of HK.
Behavior types in this category occur in late summer except on a special form (semi-rhombus-shaped) of the ridge which occurs in May or June.
Following 2 cases occur in late summer (October) followed by 1 case in September.
Cat 2 Case 1(spell)
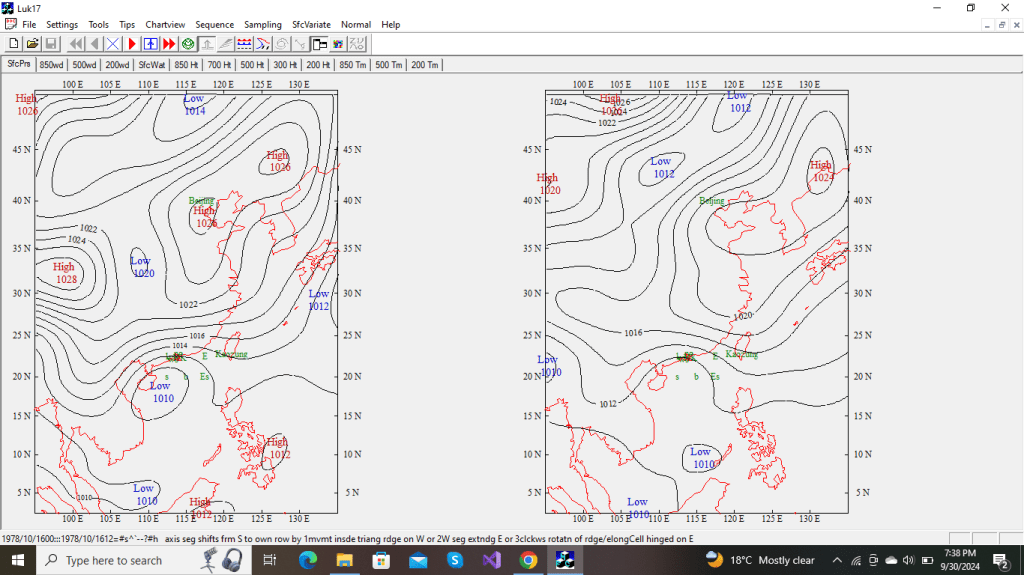
2.1: Interaction between post passage tropical storm (with a strong circulation at 850 hPa) and the strong winter monsoon surge from the northeast.
Synopsis – Ridge forceful extension followed by transformation into another type of extension :
(224.5mm) 78101612

———————————————right:- a ridge axis’s northward shifts from south row to own row on the west side of HK, or center of ridge cell lying on south/own row to west of HK sharpens its axis through HK, or (as in the current case) by clockwise rotation of axis from south row to own row pivoted on ridge center east of HK.
(121.3mm)
(supplementary) Anti-cyclonic ridge at SCS or W Pacific extends SW by axis counter-clockwise rotation further away from HK hence manifesting ridge curvature at Hong Kong.

End of spell
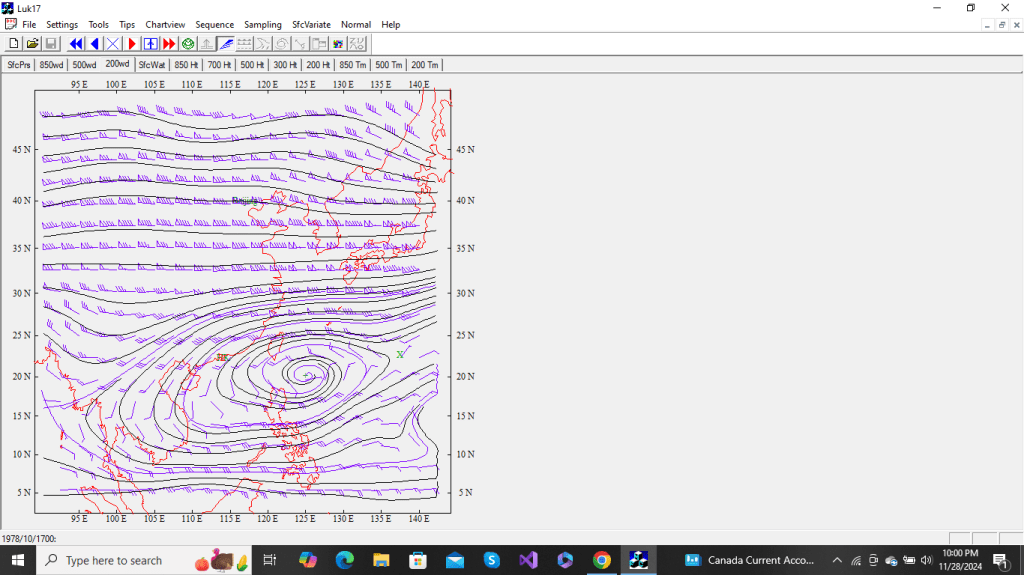
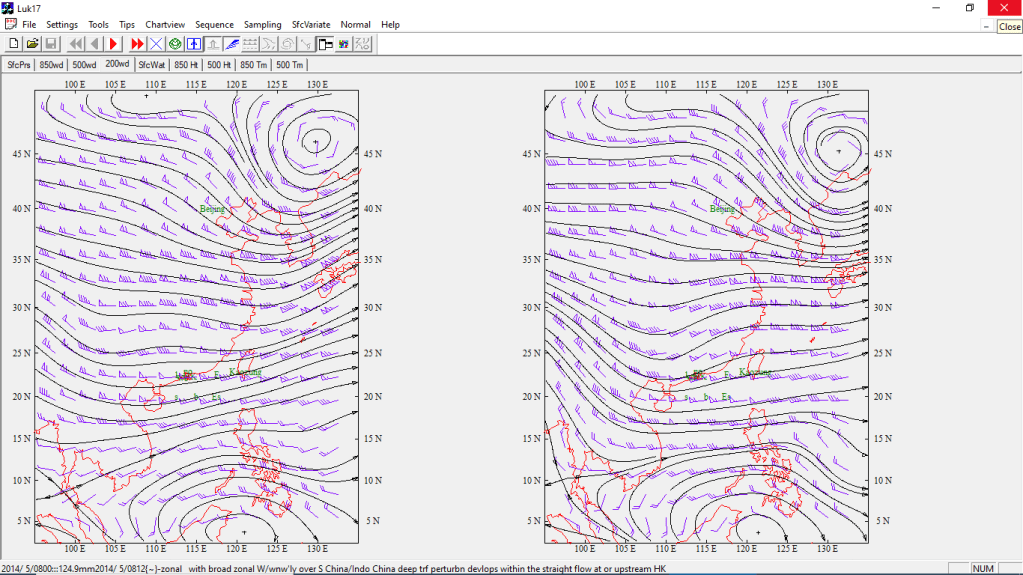
Additional example for Cat2 Case 1
(204.7mm) 17052400
Cat 2 Case 2: 249.5mm – 95100512
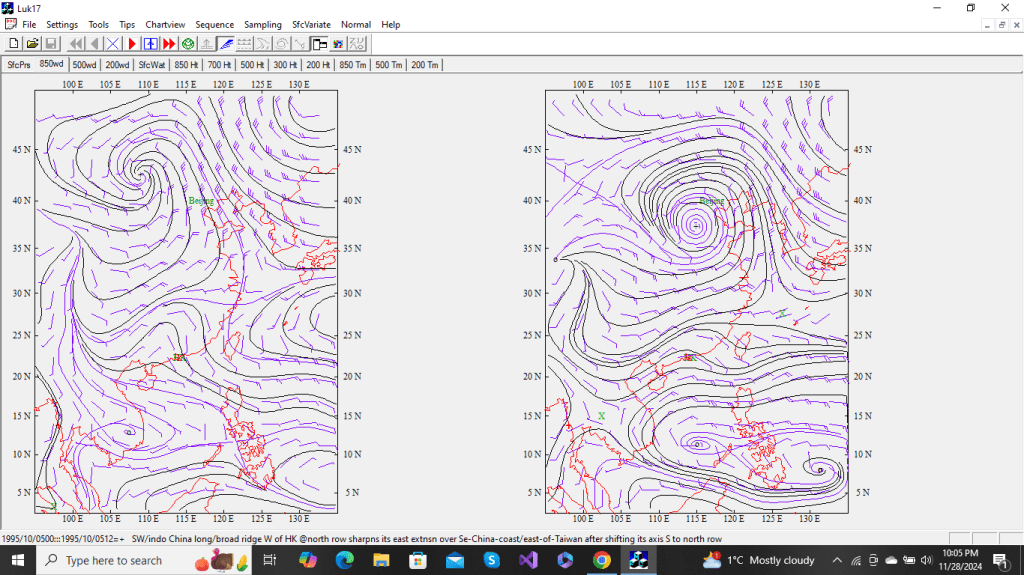
2.2: following the dissipation of TC by deep monsoon flow at the surface, coastal ridge curvature at 850 hPa is replaced by easterly wave flow

Right : southwest/indo-China long/broad ridge west of HK which is on north row sharpens its east extension over the West Pacific east of Taiwan after shifting its axis southward to reach north row.
The next 4 behavior types occur at seasonal transition months between late spring and early summer.
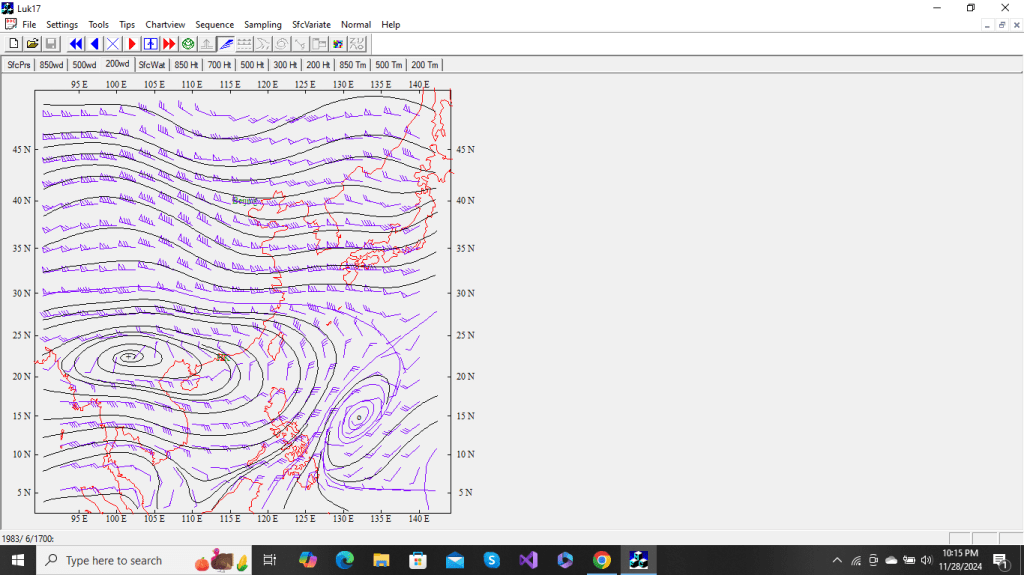
Cat 2 Case 3(spell)
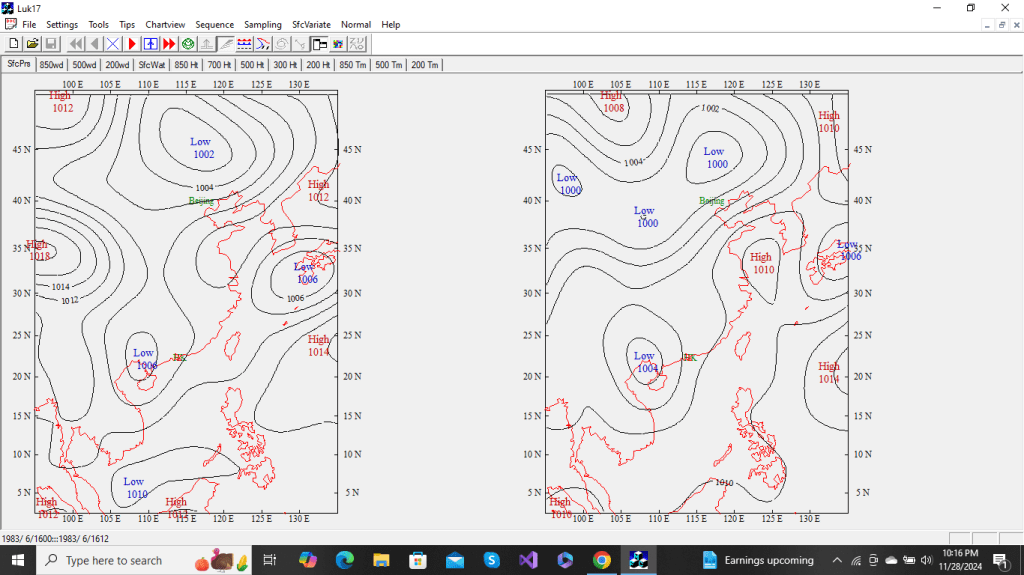
2.3: Active large low pressure at Luichow peninsula excites southwest monsoon.
Synopsis – ridge sharpening followed by ridge expansion :
(208.4mm) 83061612

——————————————right:-a broad ridge over SW China tilts east extension’s sharpened axis counter clockwise to reach HK.
(135.5mm)
Intensification of S/SW China anticyclone leads to southern or eastern expansion towards HK as revealed by ridge inflation. End of spell
Cat 2 Case 4: 202.3mm – 72061800
2.4: 850 hPa active horizontal trough close to the north of HK
(the case is referenced in Case 2.4a) Right: semi-rhombus ridge to west sharpens/shifts-up its axis to north row with HK at-weak-ridging and/or having-upstream-perturbation.
Cat 2 Case 4a (spell)
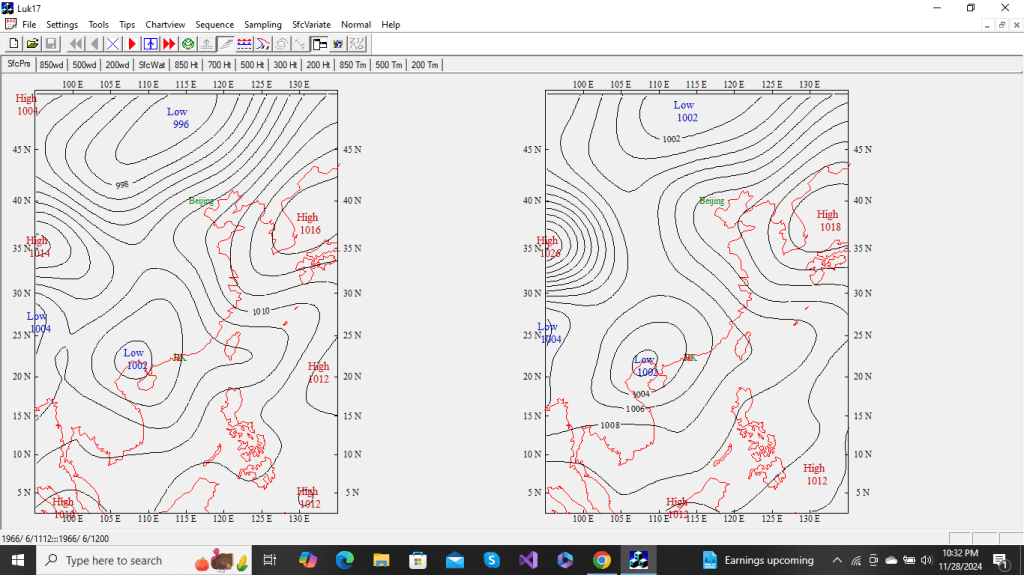
2.4a: Active low pressure over Luichow Peninsula excites southwest monsoon.
Synopsis – shifting ridge axis from north row to own row followed by its bouncing back to north row :
(245.3mm) 66061112
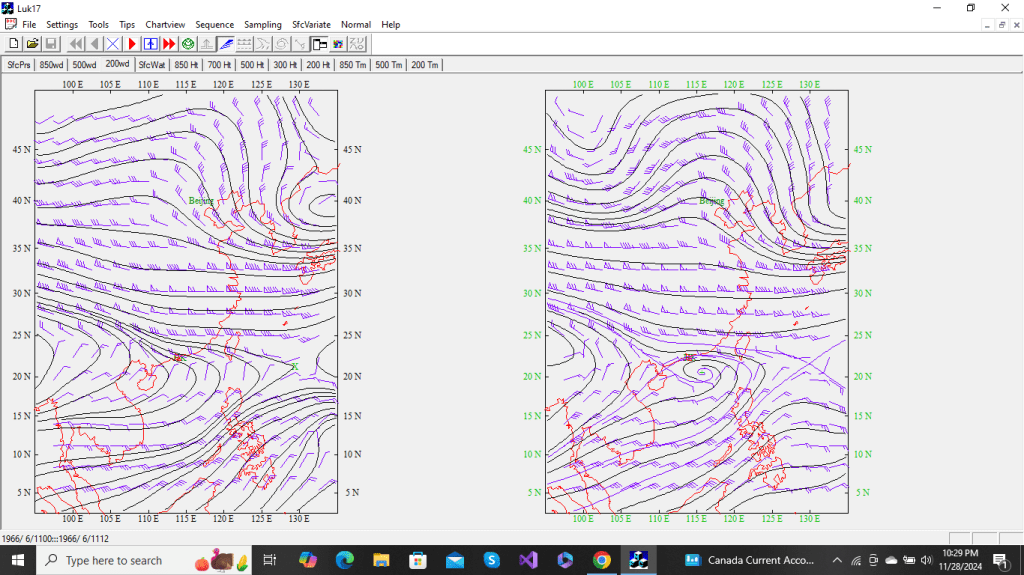
——————————————right:-semi-rhombus ridge to W shifts south its axis to own row to join its east segment at HK.
(142.2mm)
Referring Case 2.4: Semi-rhombus ridge to W sharpens/shifts-up its axis to north row with HK at-weak-ridging and/or having-upstream-perturbation. End of spell
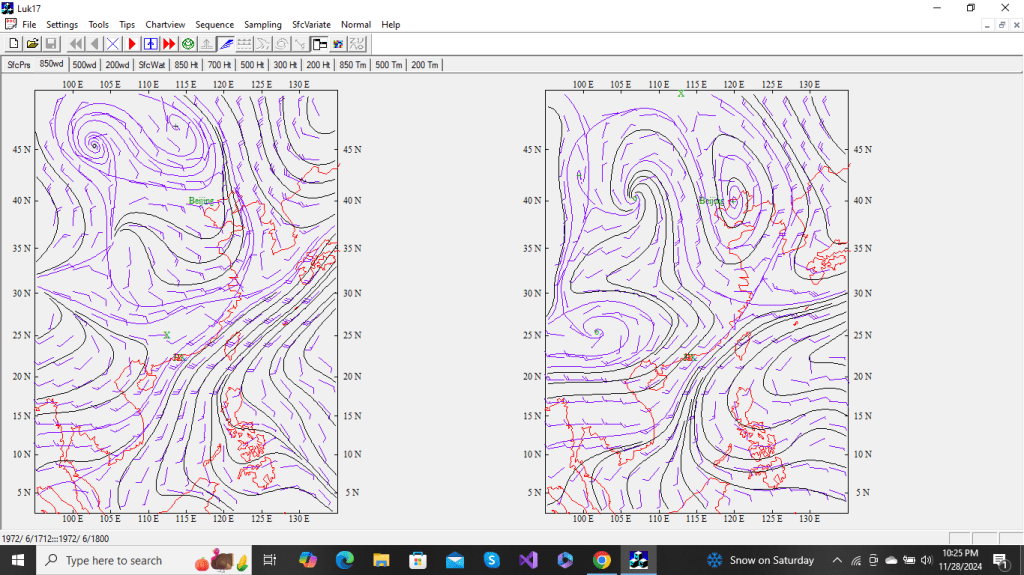
Cat 2 Case 5(spell):
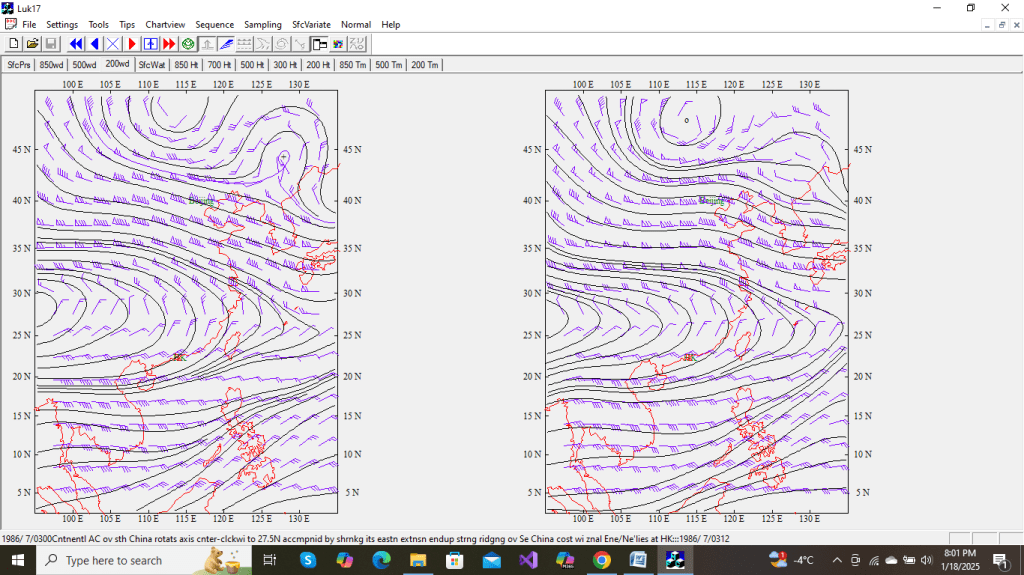
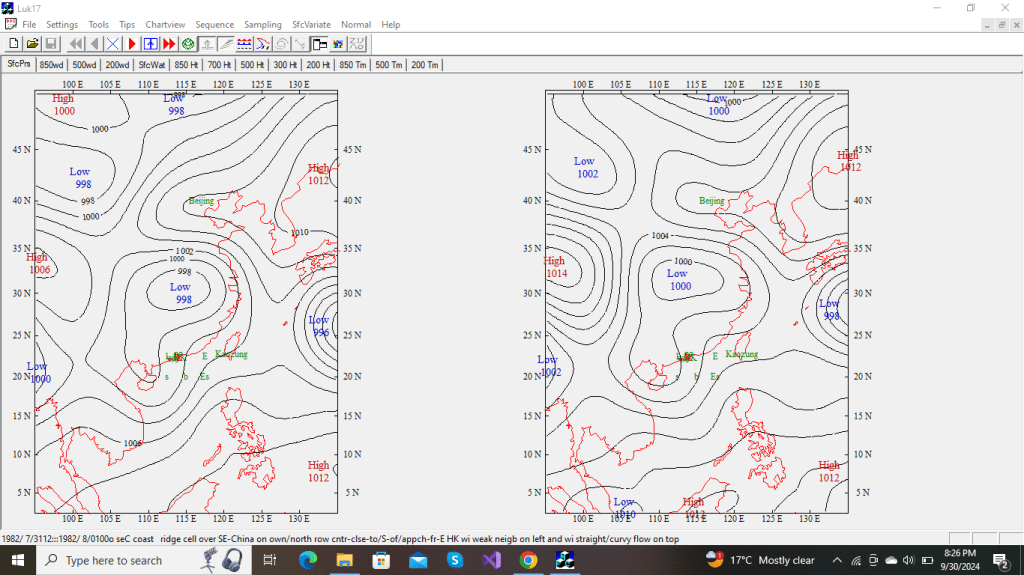
The following case represents a ridge type- the continental ridge which is mid-sized between the broad/semi-rhombus ridge discussed above and the continental anticyclone which centers at 25-27N over west China discussed in the CLOSE section. The horizontal ridge which centers at 27.5N impacts Hong Kong’s weather by intensification (which may be accompanied by an initial counter-clockwise axis rotation) through contraction, elongation and ridge curvature buildup over the Southeast China area.
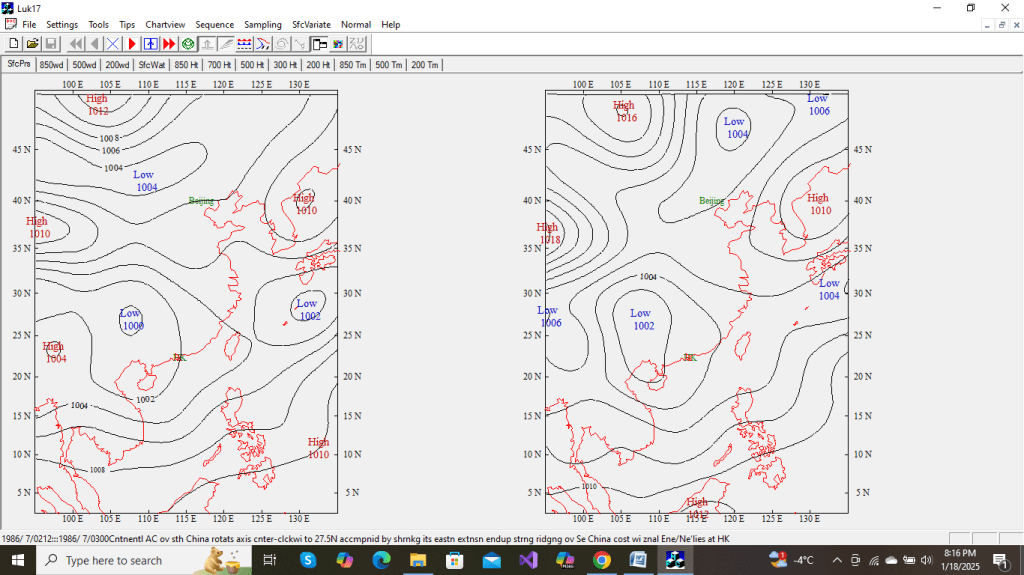
2.5: surface chart shows HK in the peripheral circulation of of a big low pressure centered to the northwest during the southwest summer monsoon.
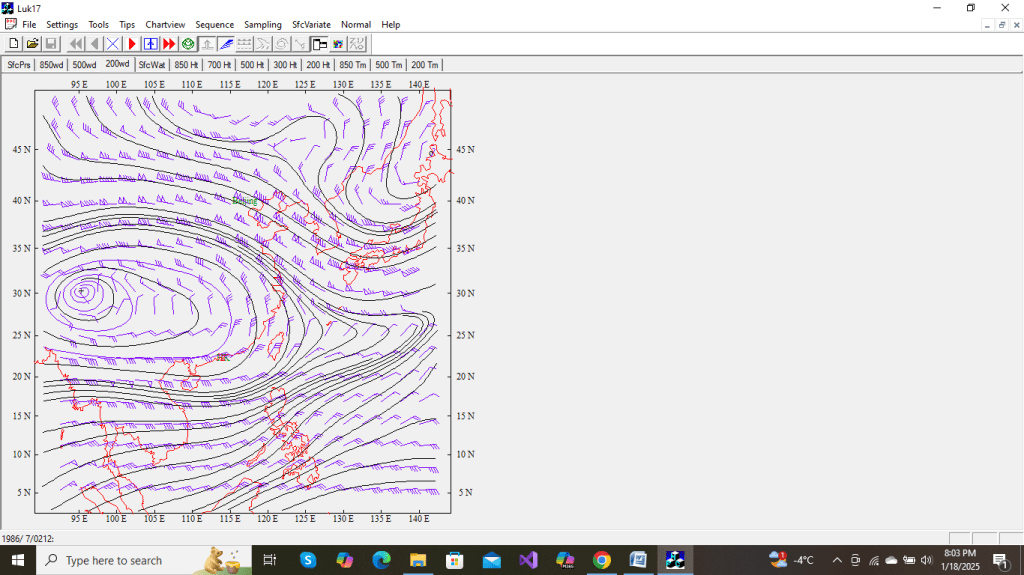
(87.3 mm) 86070300 (84.6 mm)
Category three behaviour: The first category deals with specific synoptic features active in the coastal waters of the Southeast Asia regions. The second category deals with stormy weather-borne horizontal ridges over southern mainland China. The last (third) category deals with 1) anticyclones which include a: standalone supersized continental anticyclones, b: continental anticyclones east of Hong Kong over the Western Pacific, and c: anticyclones over the northern part of the South China Sea, 2) large amplitude troughs in the westerlies and 3) the interactions between anticyclone or ridge and the high-, mid-, or low-latitude trough on-passage over various parts of the Asian region.
The third category (roughly 35%) can be called the ‘how’ category because behavior is event-driven. In describing behavior, references are mentioned on pressure systems’ location, movement, expansion, intensification, degeneration (westerly trough) on do-it-alone or interactive bases.
There is a broad seasonal spread for behavior types in this category, with 23 cases occurring in summer and 46 cases (63%) occurring between December and early June in the cool season months when mid-latitude zonal flow activity is at its highest and the large anticyclones which lie at mid-latitudes in summer are displaced to the lowest(south of 15N) latitude position.
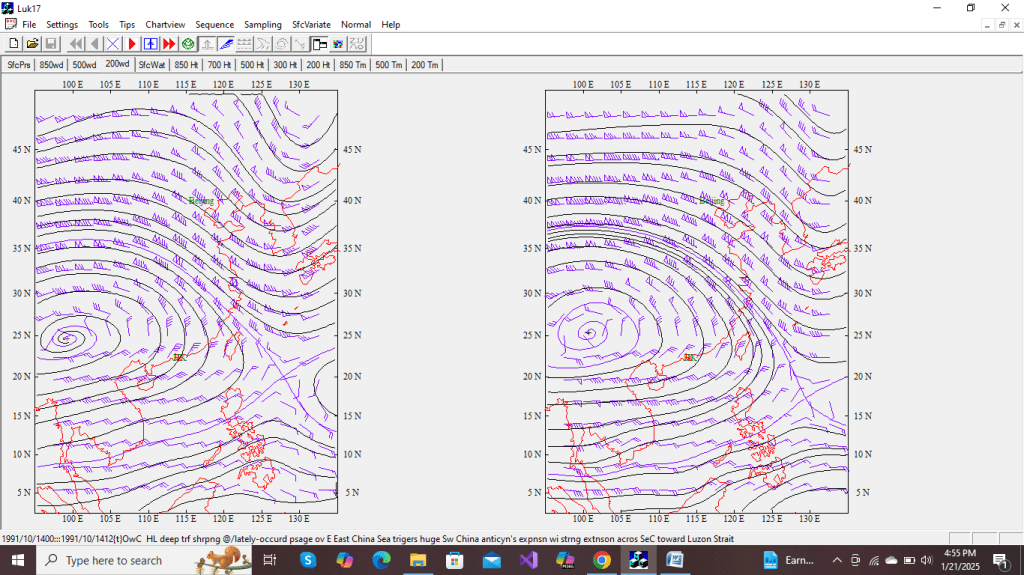
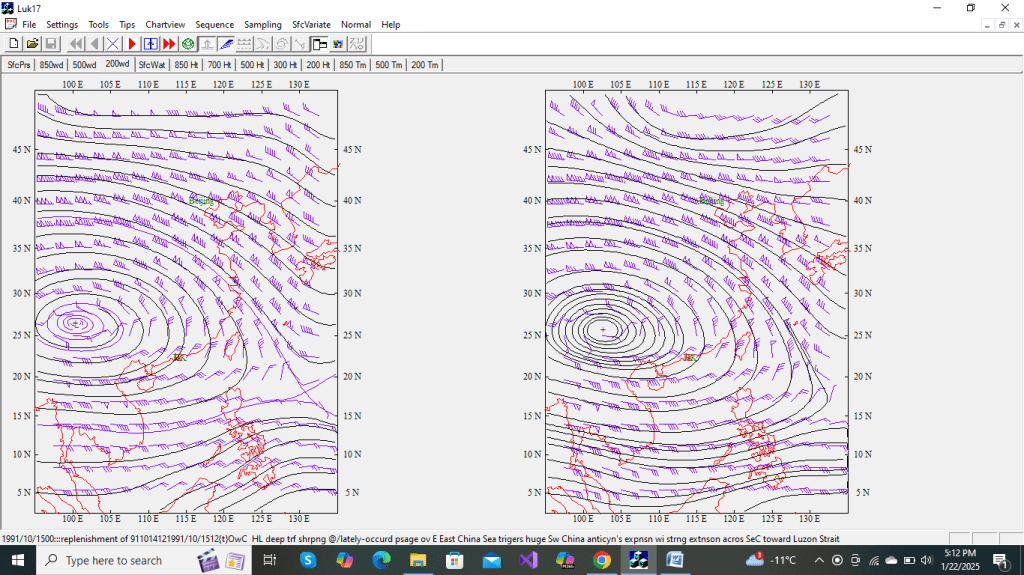
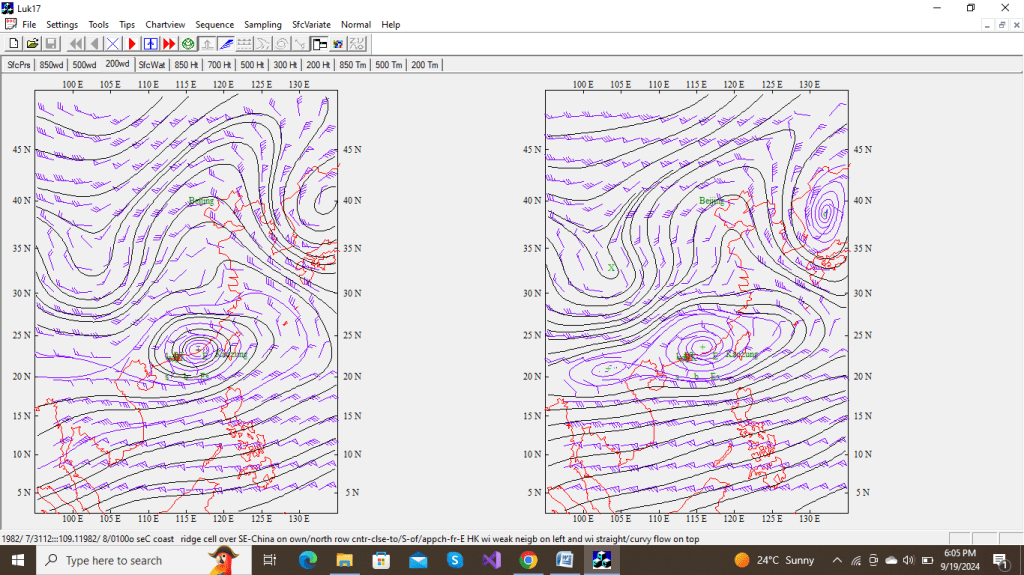
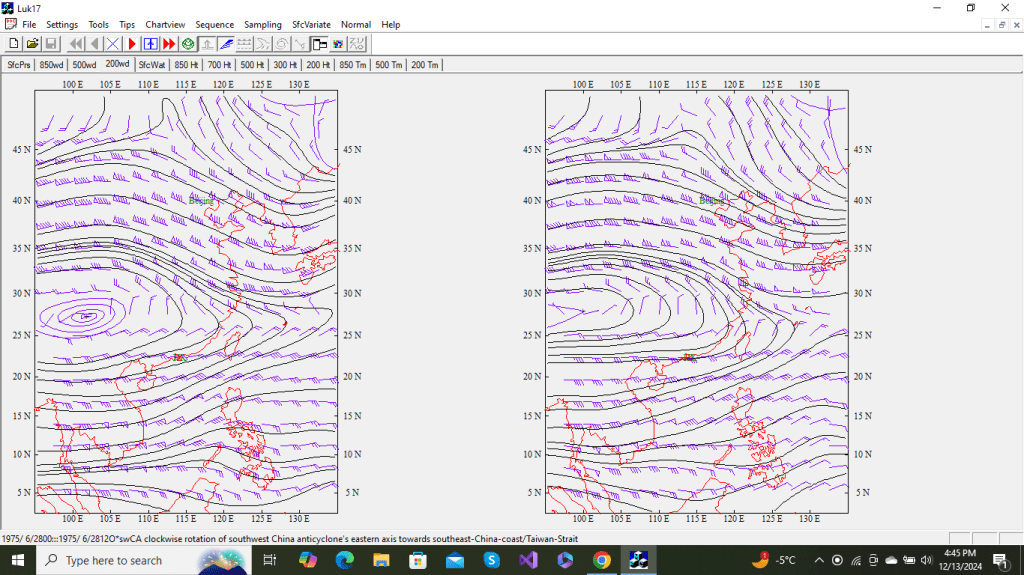
Cat 3 Case 1 – 91101500, and : A high-latitude deep trough sharpening on passage over the East China Sea triggers a huge expansion of a Southwest China anticyclone, with a strong ridge extension across the Southeast China coast towards Luzon Strait. In the current case, the behaviour recurred 12 hours after a previous occurrence.
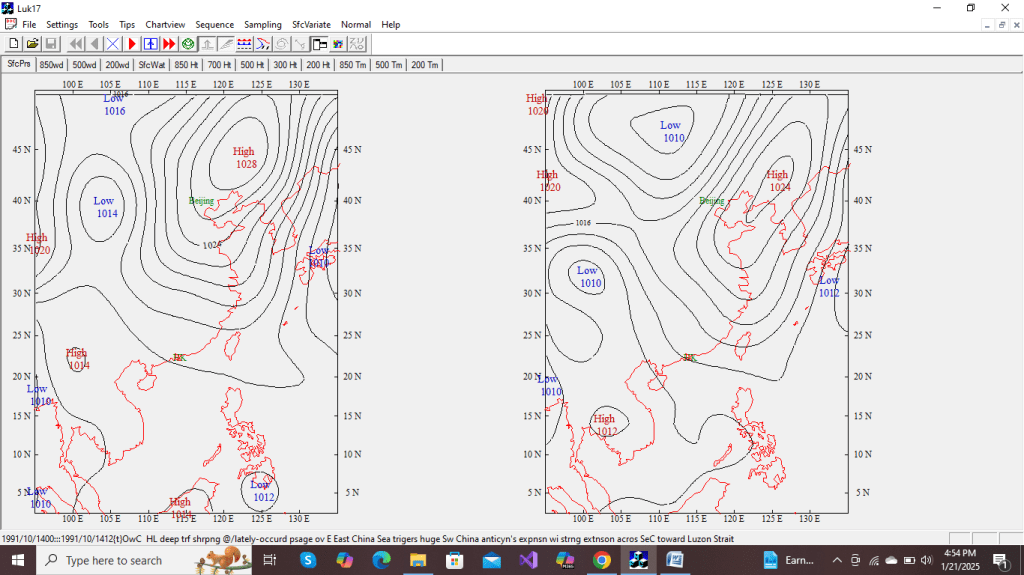
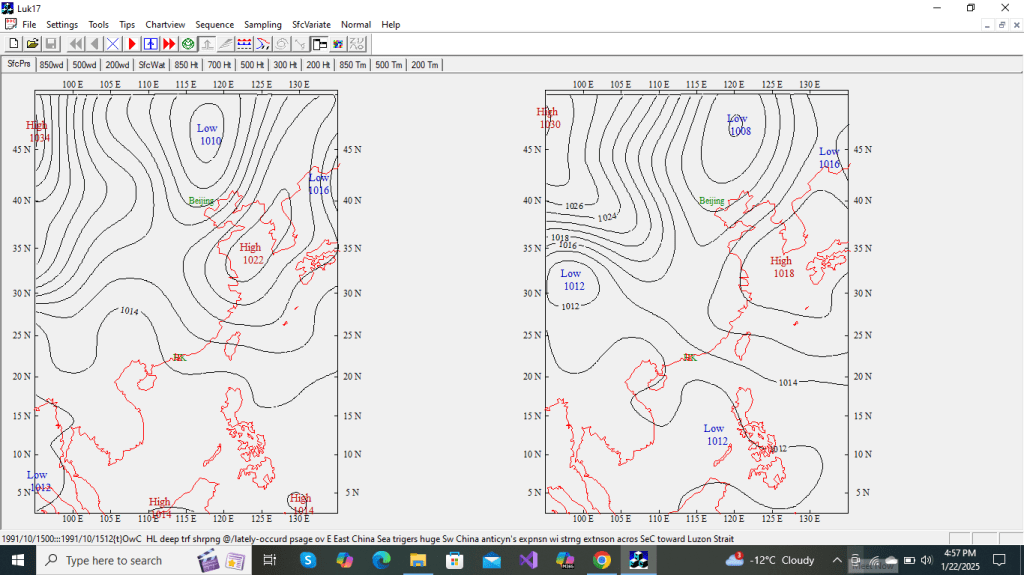
(122.9mm) 91101412(lately occurred case)
36.4mm (87.7mm) – 91101512(recurring case)
Following 4 behavior types occur in mid-summer.
Cat 3 Case 2: 83.0mm – 02092112
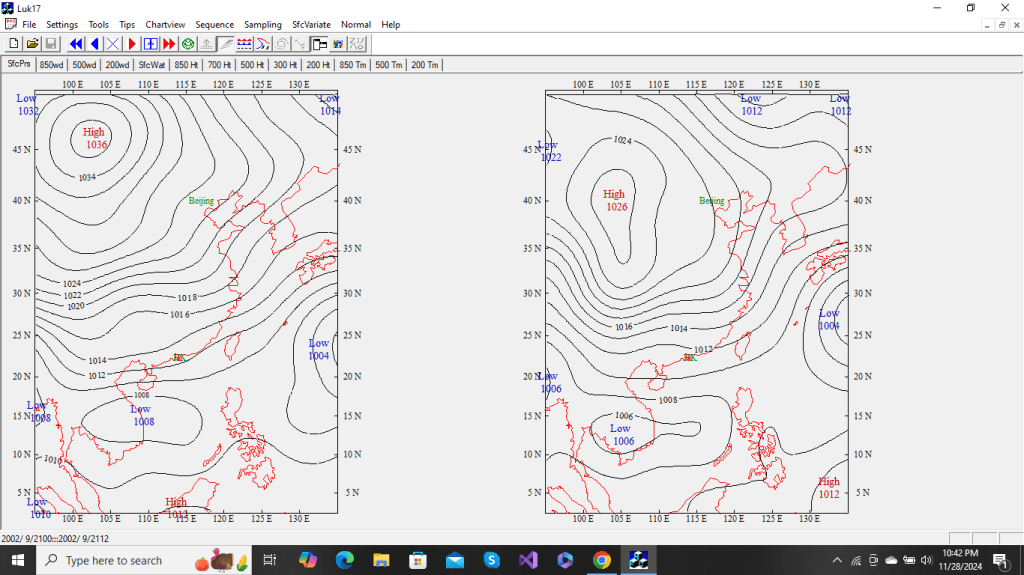
3.2: surface wind direction changes from northeasterly to highly humid easterly due to broad continental ridge shifting vertical axis from mainland to the east of HK

Right: With ridge over west China at 20-25N retrogressing deep westerly trough approaches HK from the east.
The following case focuses on impact of anticyclonic development over the west Pacific Ocean on HK’s weather.
Cat 3 Case 3: 211.6mm – 16101900
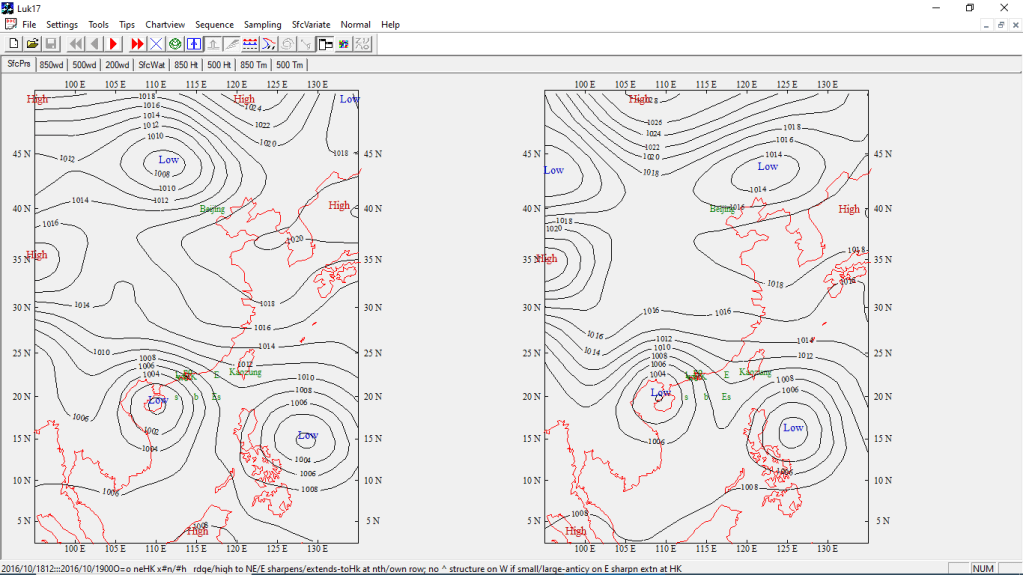
3.3: HK is affected by the southeasterly stream of a post passage Tropical Storm.
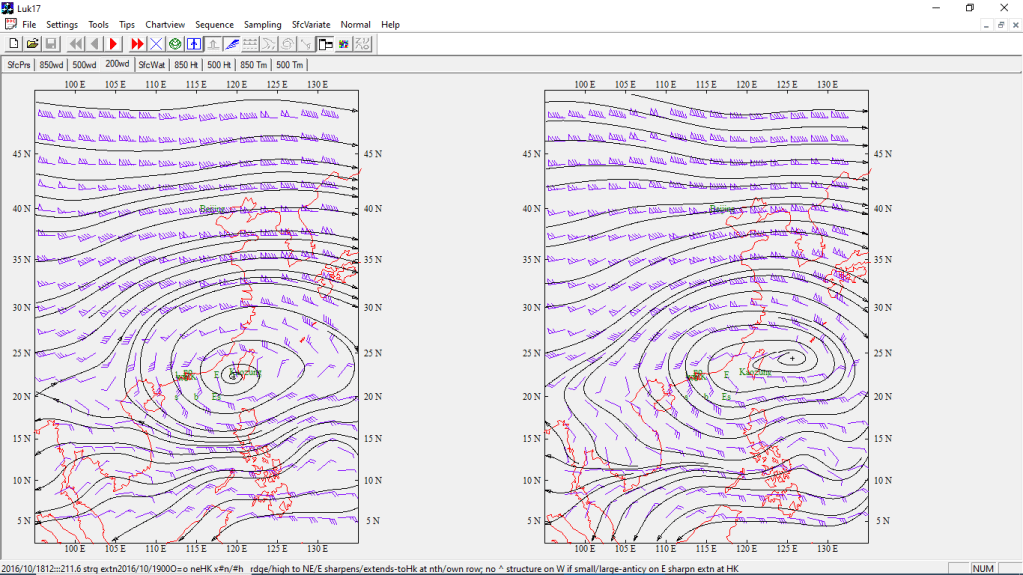
Right: A West Pacific ridge/anticyclone to northeast/east sharpens/extends its ridge towards HK at the north/own row.
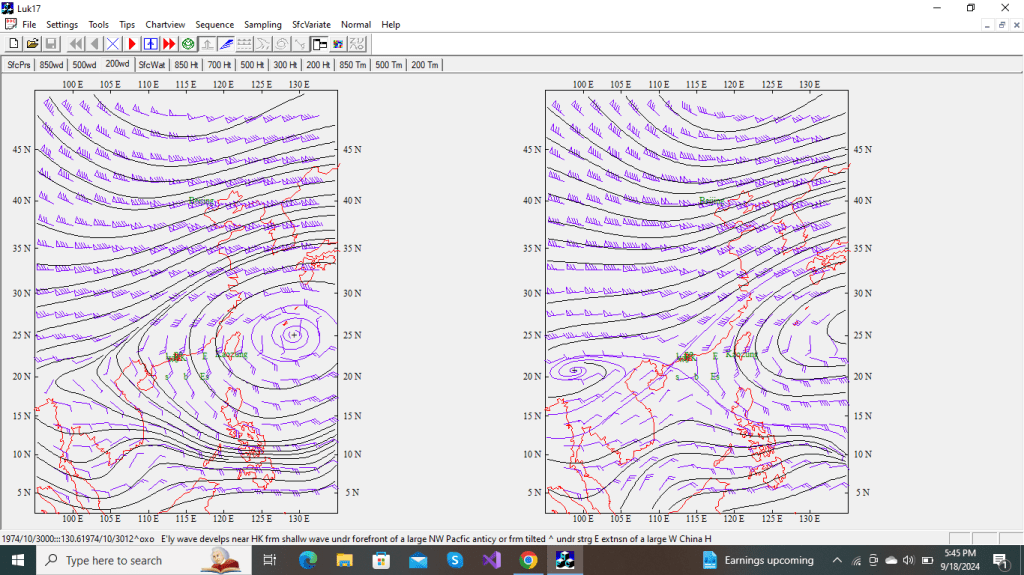
Following is another example of the same behavior when HK is within the circulation of a westward-travelling strong tropical cyclone(TC), which covered the whole northern part of the South China Sea(SCS). Historically, this scenario occurred with a 2/3 probability, i. e. only 1/3 occurrences of this behavior is not associated with TC to the S/SW of HK over the SCS.
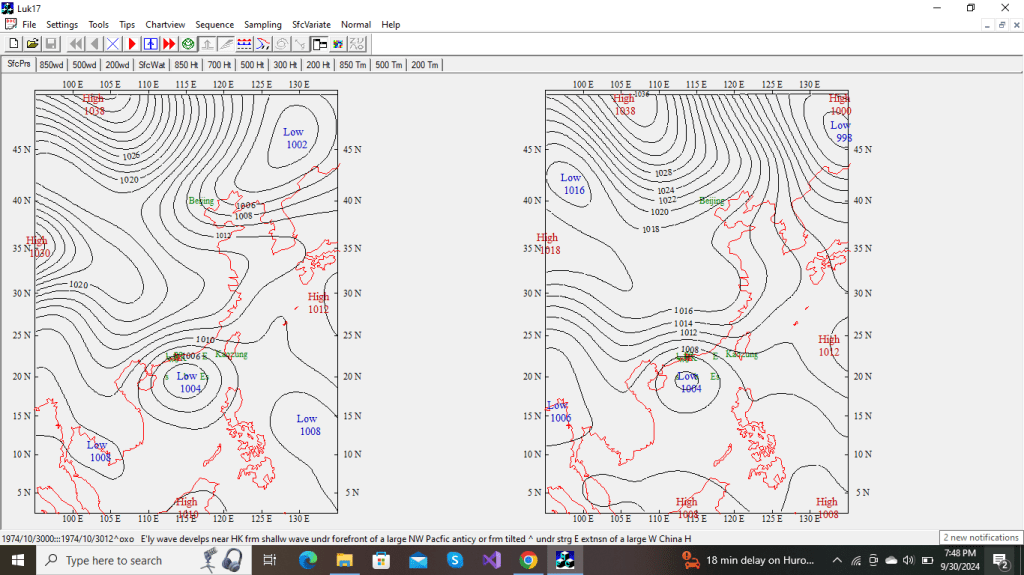
65.5mm (130.6mm) 74103012
The scenario of the following 2 developments focuses on mainland China’s anticyclonic expansion.
Cat 3 Case 3b(spell)
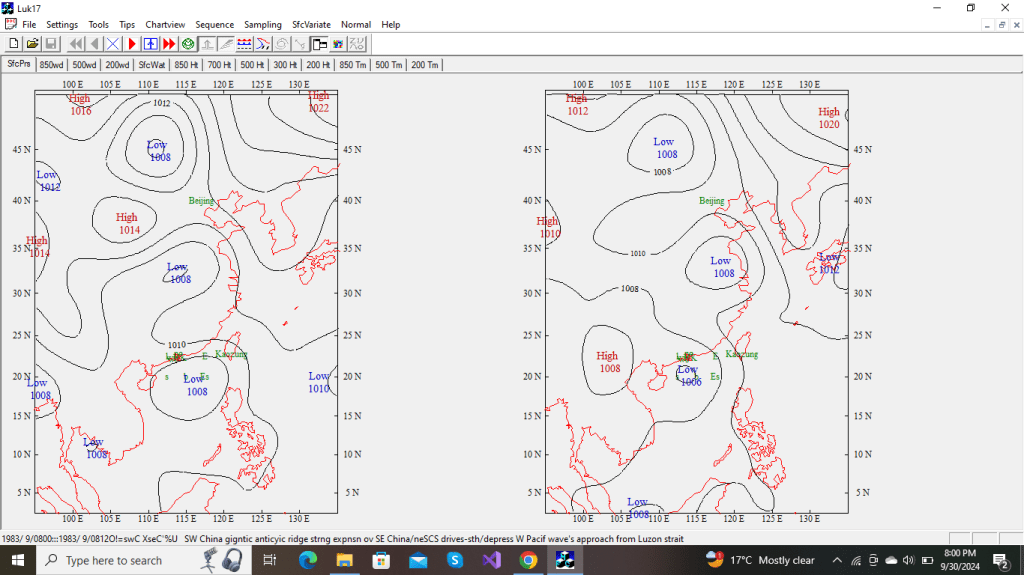
3.3b: post passage of tropical depression to south
Synopsis – The expansion of a continental anticyclone’s southeast portion causes the horizontal trough to its southeast southern depression, followed by a easterly perturbation formation:

(101.7mm)83090812 (98.0mm)
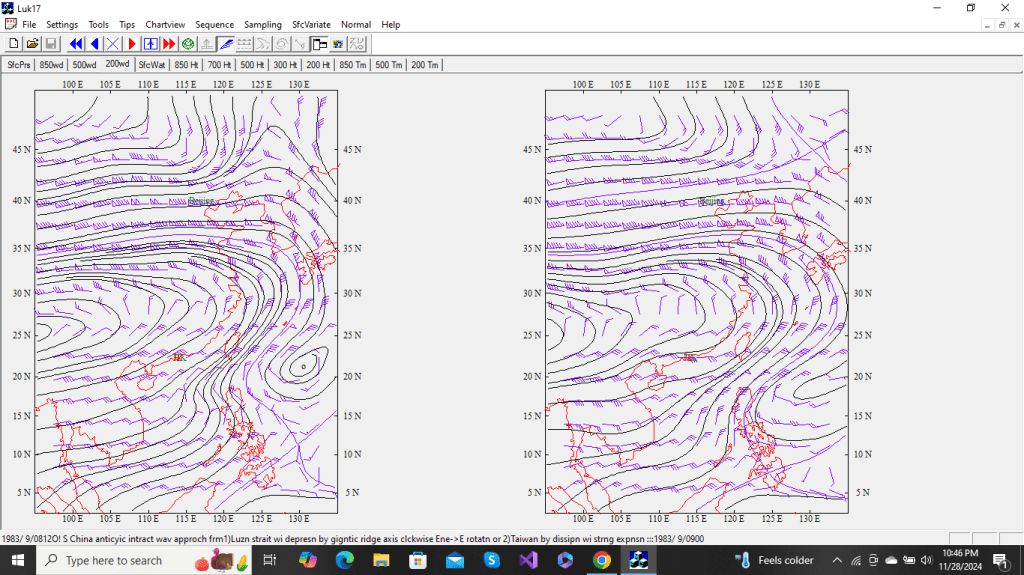
Left :- southwest China’s gigantic anti-cyclonic ridge axis’s strong clockwise rotation from east-northeast to east drives-away(depresses) on W Pacific wave’s approach from Luzon strait. Right :- under the strong continental anticyclone to north, easterly wave-like perturbation develops at HK within the zonal easterlies following continental ridge intensification at SE China through (as in this case) the ridge’s expansion at SE China with re-orientating NE’lies to E’lies to establish a E-W zonal flow, or through (as in Example 4) ridge’s forming a strong high cell at its eastern extension at SE China. End of spell.
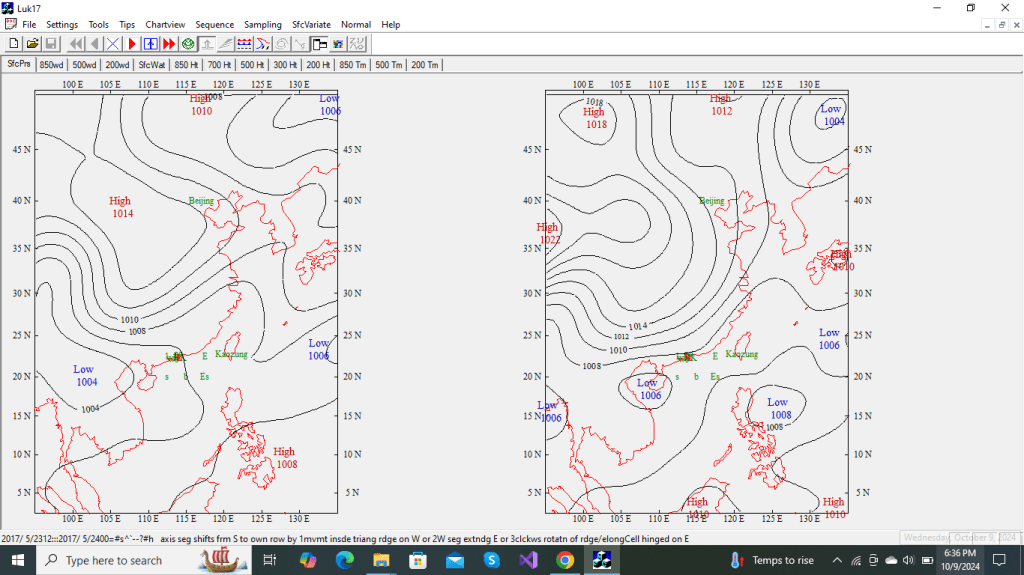
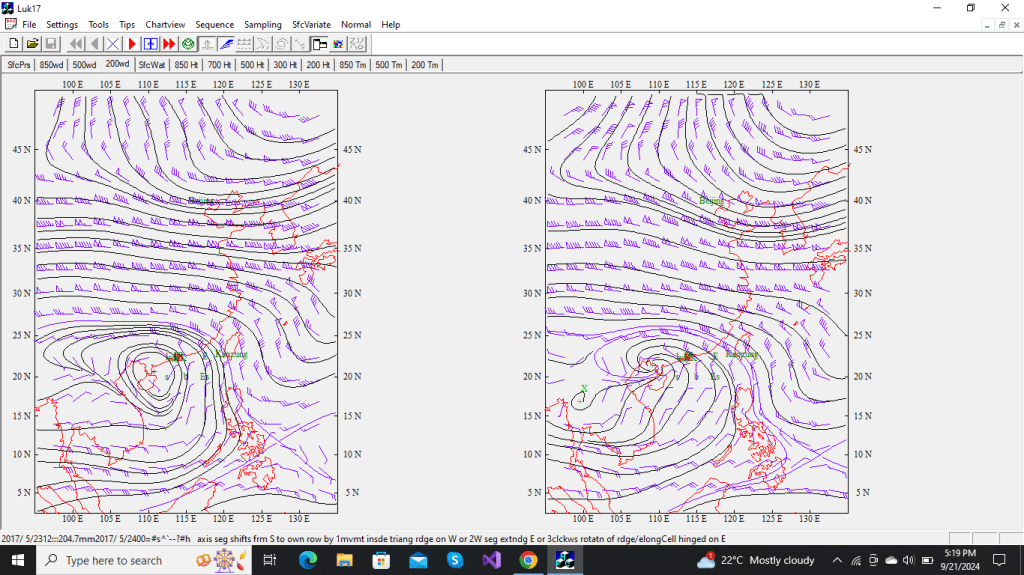
Cat 3 Case 4(spell)
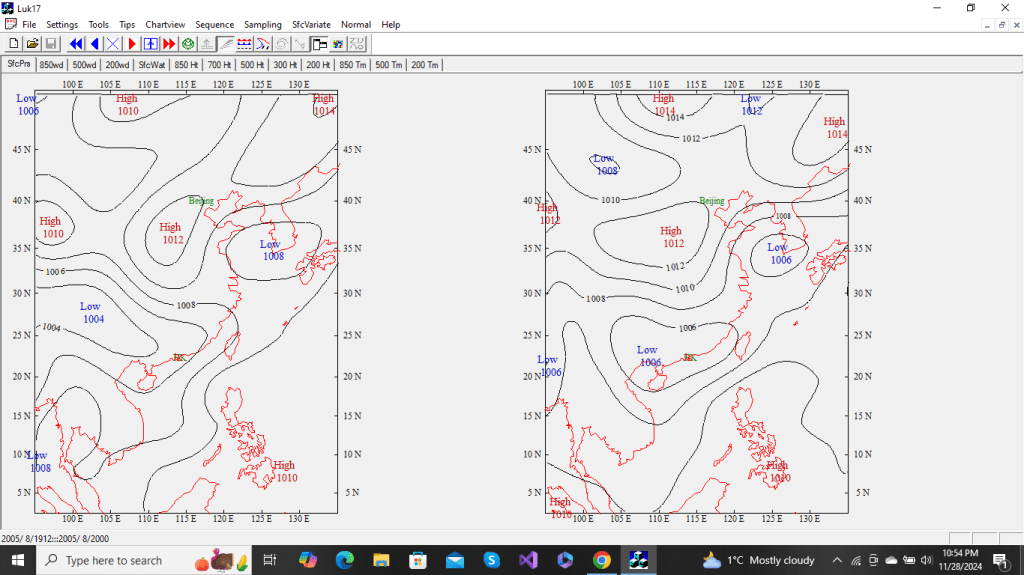
3.4: Active surface trough north of HK moves south to HK.
Synopsis – passage of a high latitude trough followed by passage of a mid-latitude trough trigger anticyclonic expansion :
The following behavior definition applies to each period in the spell below:
The behavior is also referred to in a) Example two(21062800) following the *Remarks in the Verification section below and b) the most dramatic interactive behavior type ever occurred (74082300) in the end of CLOSING (standalone Anticyclone) section.
A trough newly formed at Hour+0 or lying at Hour-12, between Central China and the East China Coast to the North-northeast of Hong Kong, shows Hour+0’s deep shrinking or sharpening effect on the West China anticyclone’s east extension ridge underneath. Its subsequent eastward passage triggers a tremendous ridge expansion over southeast China and the northern part of the South China Sea.
(106.8mm) formed

———————————————–Right hand side :-(similar behavior also referenced in the most dramatic case at the end of the CLOSE Section).
(179.8mm) (208.8mm) 05082000
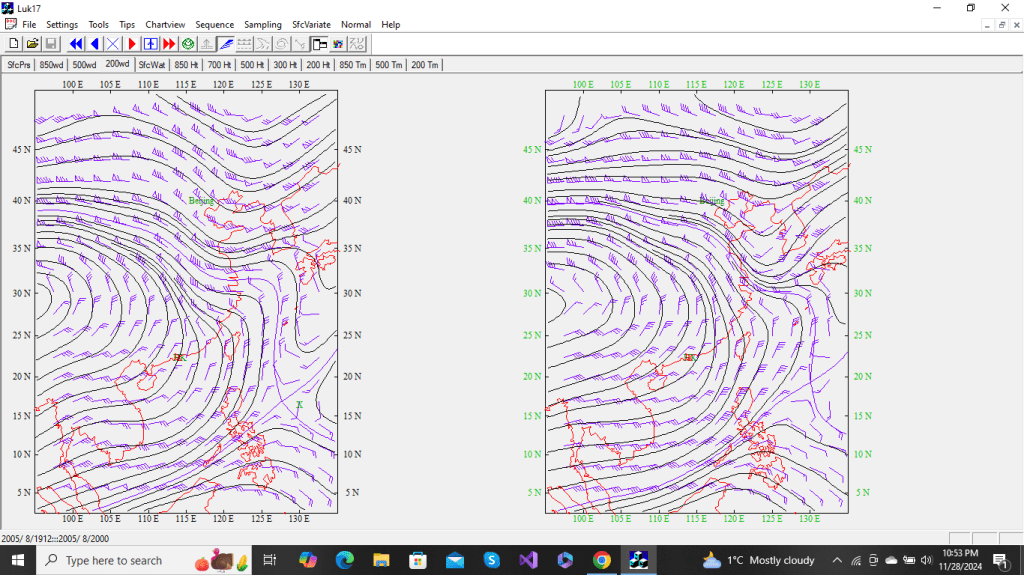
The left side shows the extension ridge now became a narrow extension ridge tilted ahead of the trough. The right chart shows lying south of the trough, the ridge became once again the extension front of the mainland ridge.

End of spell
Following behavior prevails in the cool seasons.
The scenario of the following 2 developments centers on a zonal westerly flow pattern over most regions in the north with remote anticyclone to the south of HK.
Cat 3 Case 5: 204.3mm – 89050200
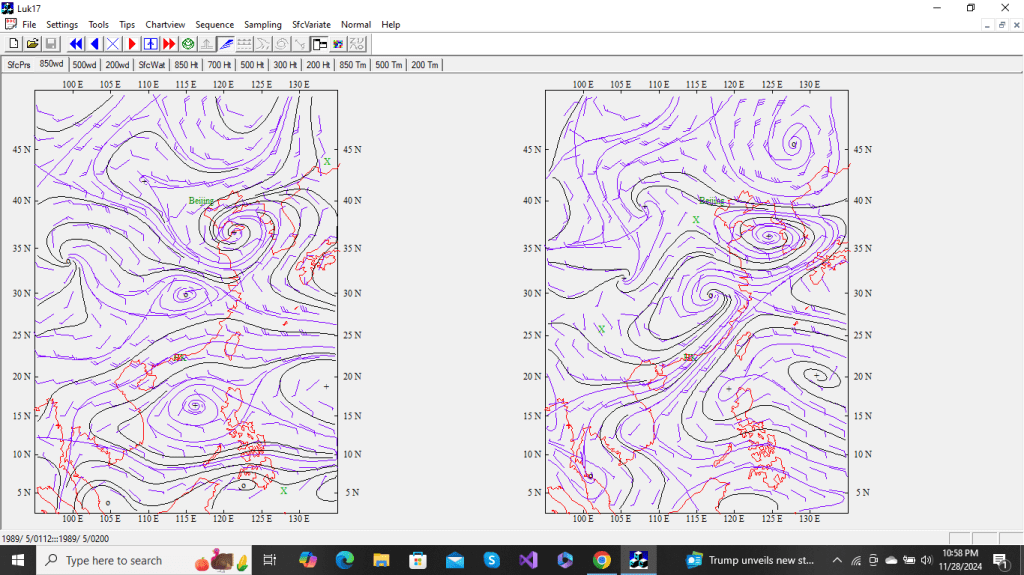
3.5: at 850 hPa curvature changes from anticyclonic to cyclonic
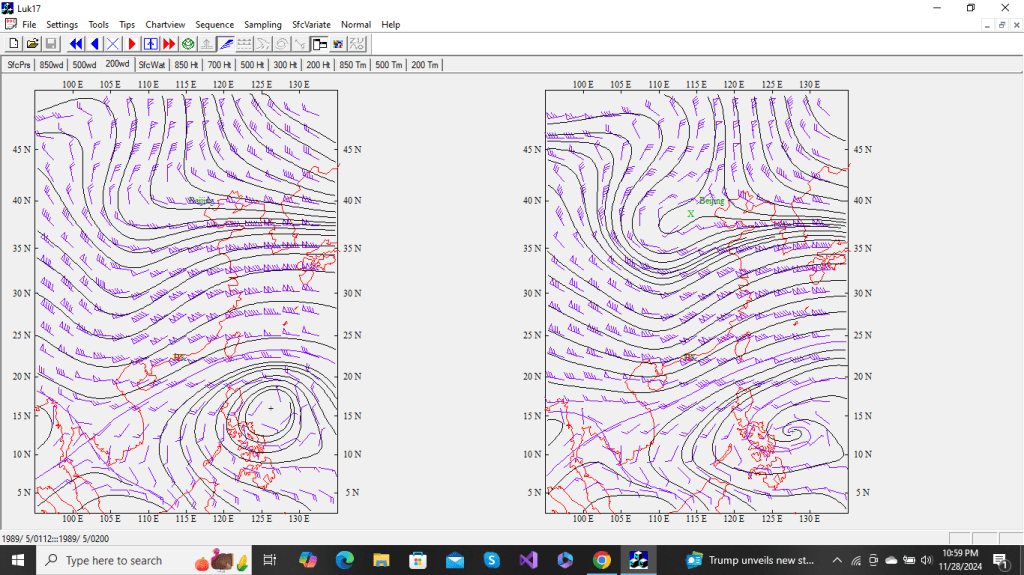

On passage of fast curvature-weakening long baroclinic (accompanied by virtual behavior type1) wave in the westerlies near Hong Kong
Cat 3 Case6(spell)
3.6: Low pressure system moves eastward reaching HK.
Synopsis – slow extension/expansion of large anticyclone to southwest :
(170.4mm) (153.7mm) 92050800
apply each side:-(cool season) with big anti-cyclone to HK’s southwest centred below 15N and zonal winds along 22.5/25N up to HK <273, ridge expands towards northern SCS and Taiwan. End of spell
The scenario of the following 2 developments focuses around an anticyclone or a large ridge in the South China Sea.
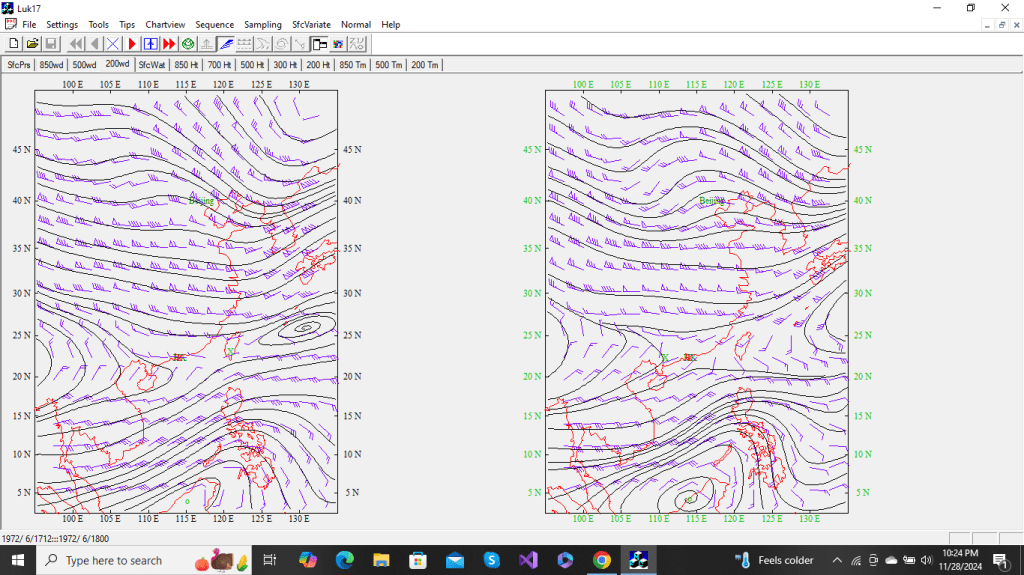
Cat 3 Case 7: 205.1mm – 70051300

3.7: active surface trough north of HK moves south to HK
Over the South China Sea, an anticyclone’s northern part intensifies with sharpened curvature/tilting at ‘own row’ between HK and the western Pacific Ocean thereby tremendously strengthening its entire eastern extension ridge.
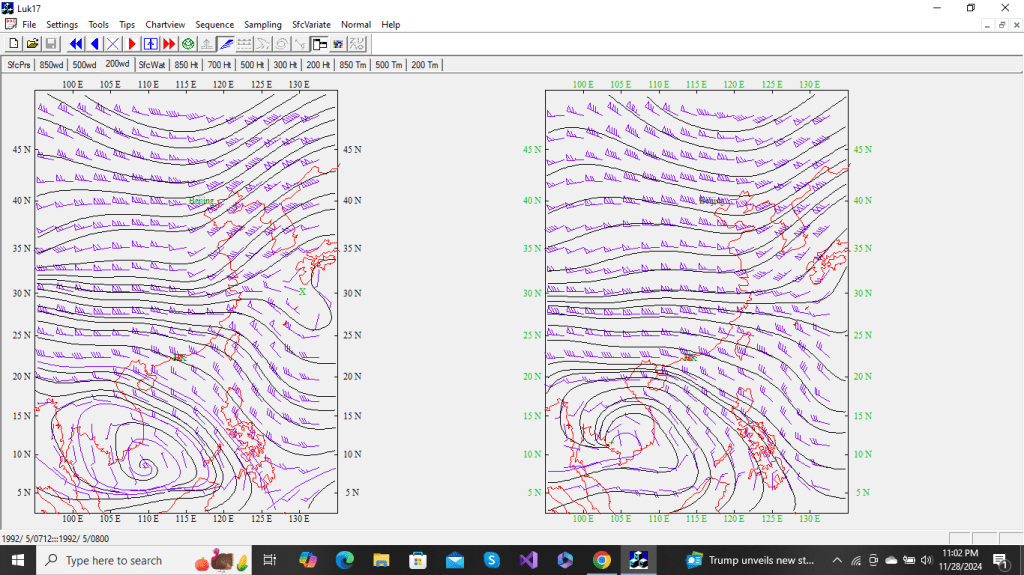
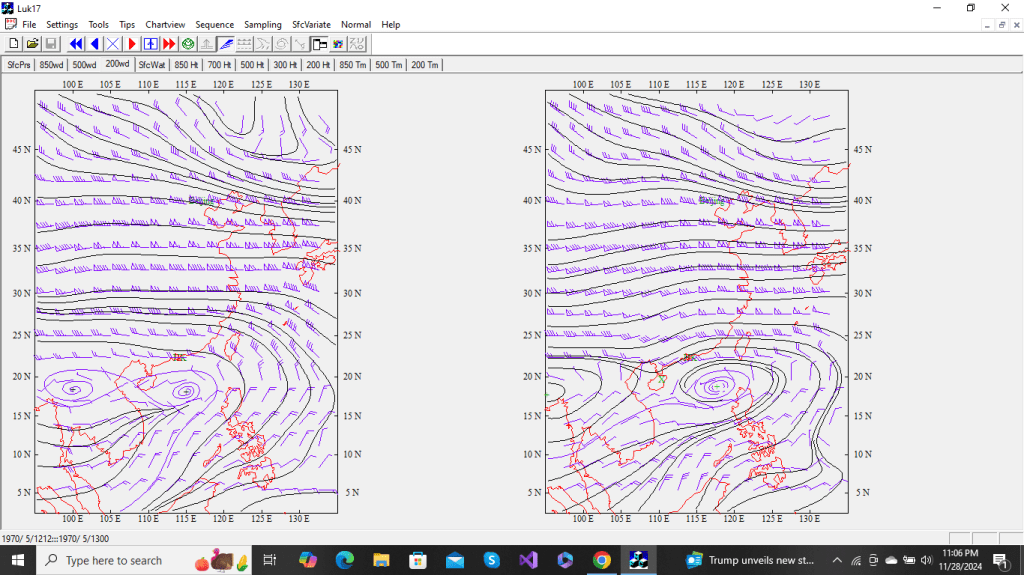
Cat 3 Case 8(spell)
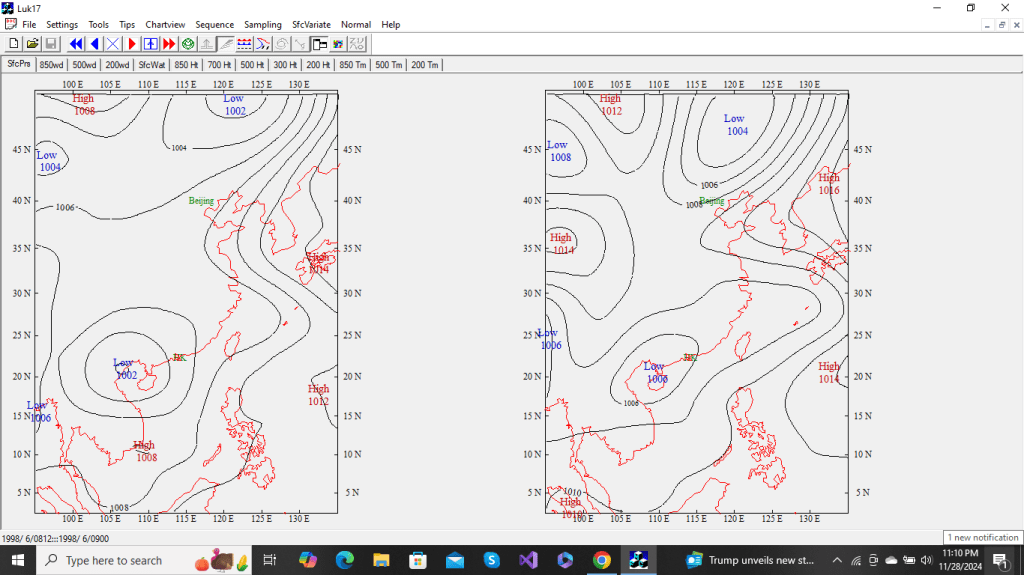
3.8: Active surface trough prevails along the entire south China coast.
Synopsis – the intrusion of a strong anticyclone from southeast followed by a 2-staged tremendous intensification :
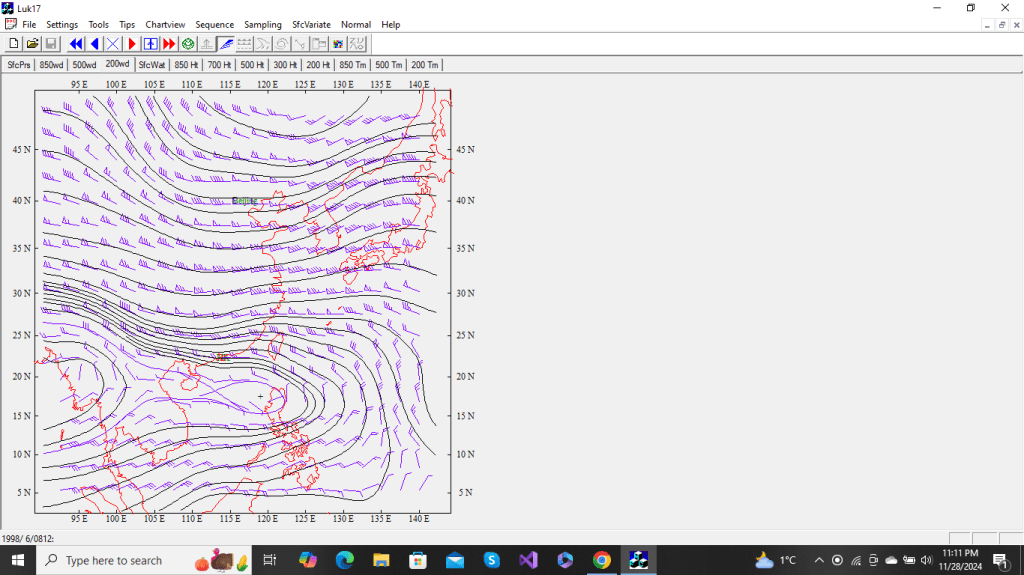
(167.1mm) (260.1mm) 98060900

Left :-Intrusion or intensification by bulging of strong anticyclone/ridge at south row over the South China Sea to the west of Luzon. Right :-vigorous westerly trough’s tip closeups a downstream strong ridge resulting abrupt curvature reversal with HK at the point of inflection on the streamline trajectory.

End of spell
The scenario of the following 2 developments focuses on trough formed over central China in between ridge at 20-25N over west China and HK moves eastward with the ridge following closely behind undergoes expansion before or upon reaching HK.
Cat 3 Case 8a: 295.7mm – 71081612
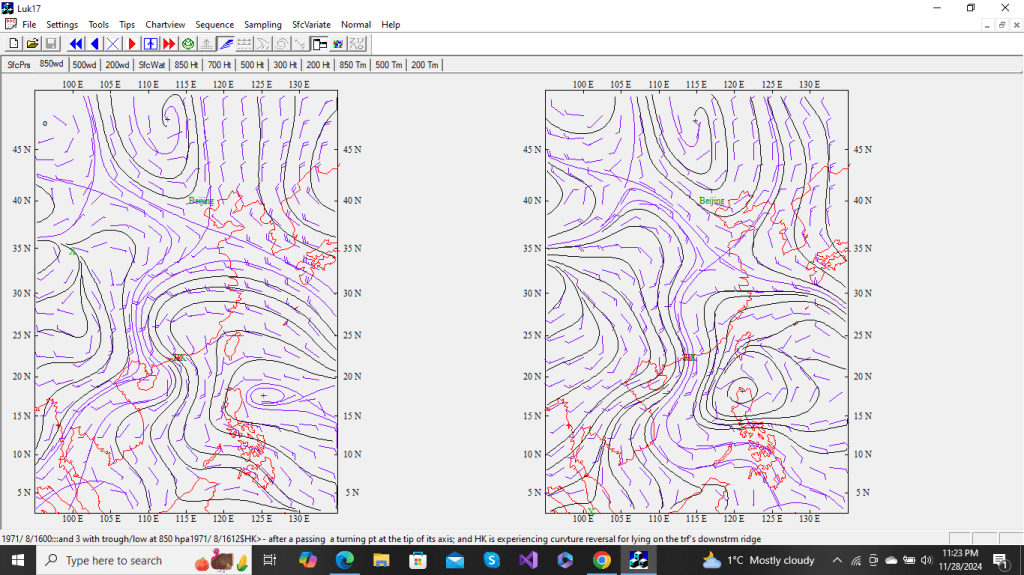
3.8a: trough passage at 850 hPa
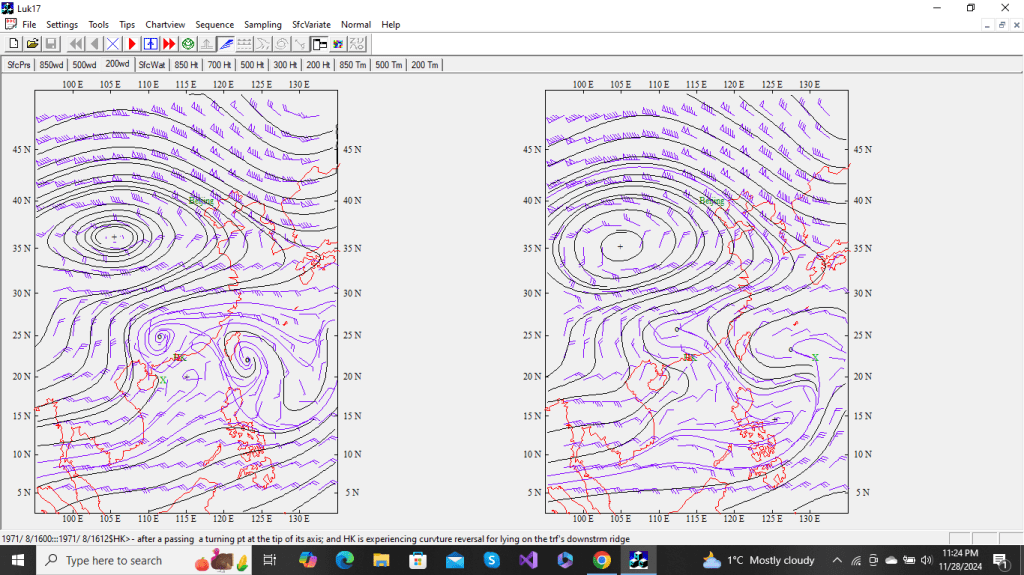
Right :After passing an upstream horizontal trough’s turning point on its axis, the flow reached HK at the inflection point on a downstream ridge, resulting in a curvature reversal at HK between the upstream trough and downstream ridge.
Cat 3 Case 9(spell)
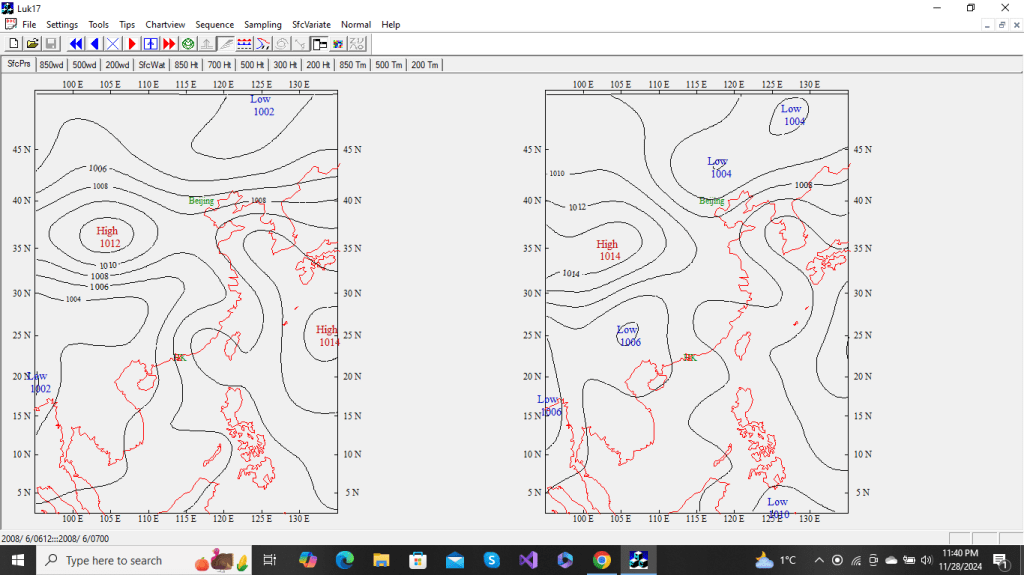
3.9: Slack trough rapidly sharpens along South China coastal waters.
Synopsis – passage of a slow-moving westerly tough followed by the arrival of a phenomenally expanding anticyclone :
(116.7mm)

————————————–right:-(supplementary)Speed divergence ahead of a forward tilting westerly trough
(119mm) (199.6mm) 08060700
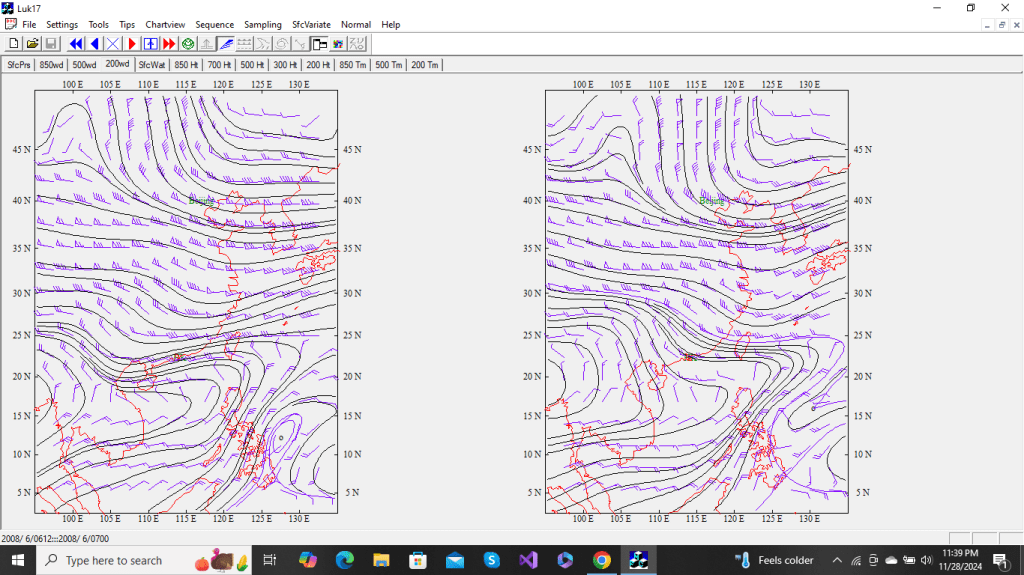
left:-same as the last behavior—–right:-Passage of the tip of a short forward-tilting low-latitude trough over Hong Kong accompanied by phenomenal anticyclonic expansion over Southwest China behind it.

End of spell
Cat 3 Case 9a: 218.7mm – 68061212
3.9a: significant increase in the cyclonic curvature in the southwesterly flow at 850 hPa
Right :After the passage of the tip of a long slightly-tilted low-latitude trough over Hong Kong, huge anticyclonic expansion occurs over southwest China behind it.
It is obvious from the foregoing descriptions in Category 3 that anticyclonic expansion or intensification (in all 12 cases except cases 2 & 5 which are about westerly troughs), may it be close by or reaching-HK-from afar or extending far to HK’s east, plays the key role in providing the driving forces to the most stormy situations in this category.
Virtual behavior category:
The category can be called the ‘why’ category because it raises the question the heavy rain occurrences cannot be answered by behavior at 200 hPa.
Type 1 Virtual behavior – 85.6 mm
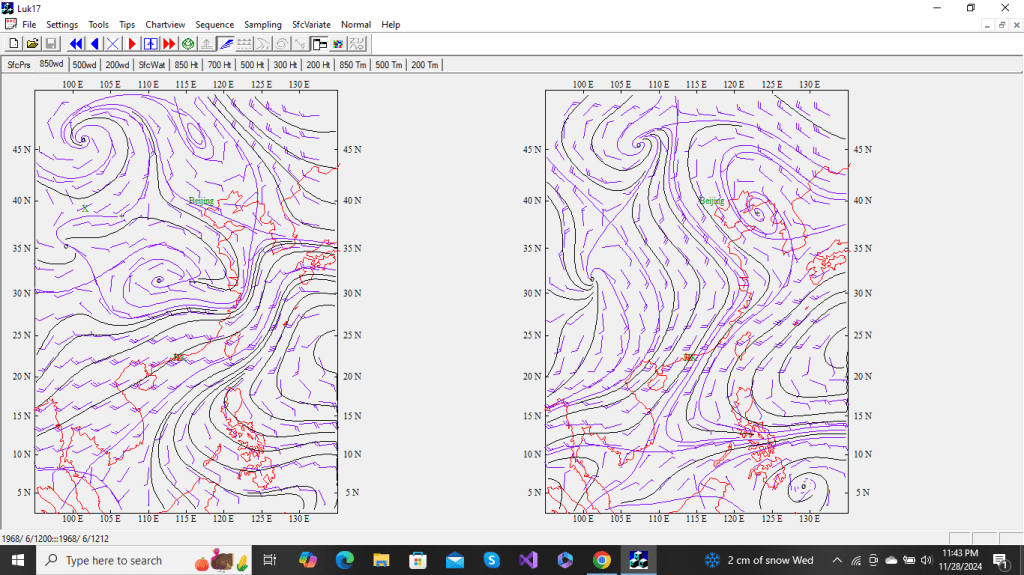
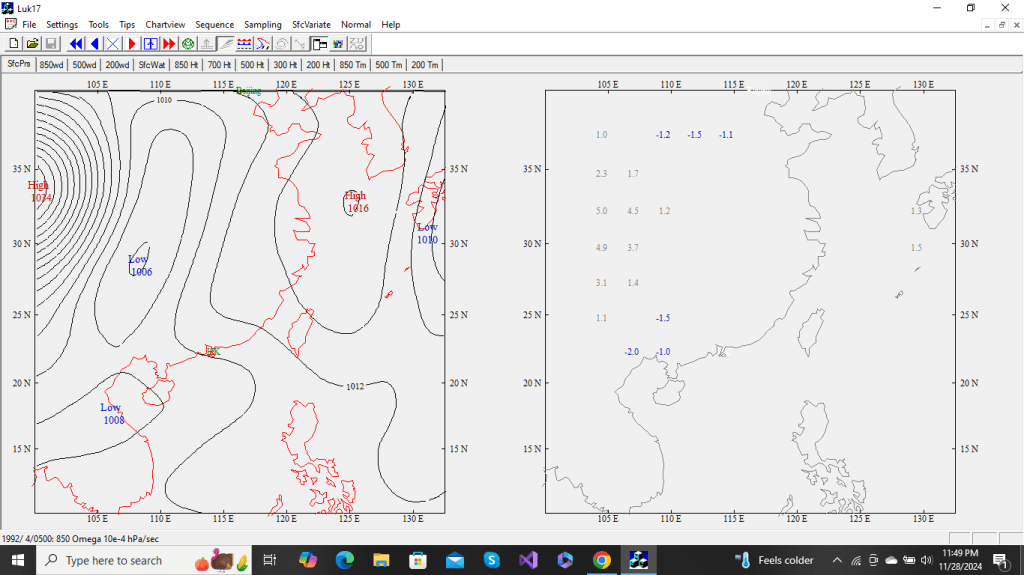
On rare occasions (less than 5), heavy rainstorms occurred in the cool season with no sign of behavior. But they could be detected from the set of two omega charts (vertical velocity at 850 hPa) which forms the first virtual behavior.
(note: On the two 850 hPa streamline charts (not shown here), large scale southerly flow could be observed over west China to the west of HK.)
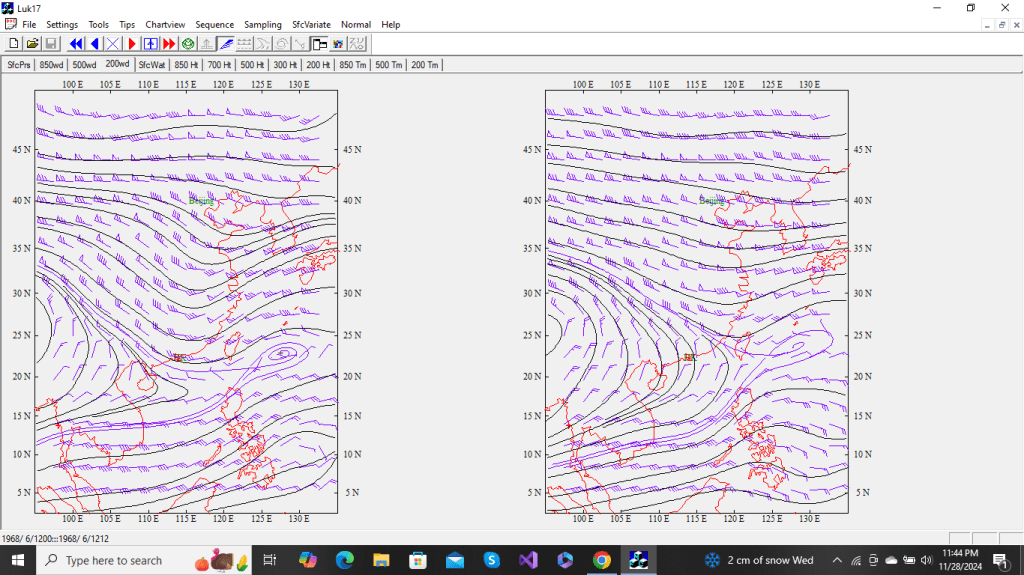
Chart 1 92040500 at 200hPa, only shallow curvature can be observed from the broad zonal westerly flow over China mainland showing no behavior
92040500
Chart 2: 92040412 850 hPa at T-12 hour active omega activity can be observed over the Hainan Island area
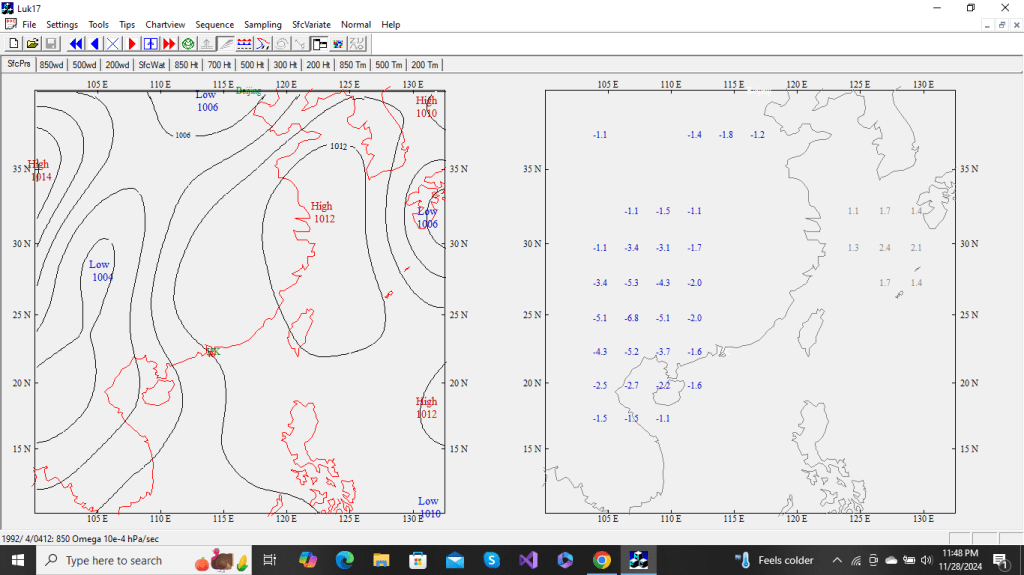
Chart 3: 92040500 Under normal non-rainy situations, the whole bunch of vertical velocity activity would translate eastward over southern China with little change in intensity. But here such activity subsides when it travels to the HK area on the actual 850 hPa at hour+0
Type 2 Virtual behavior – 149.0mm
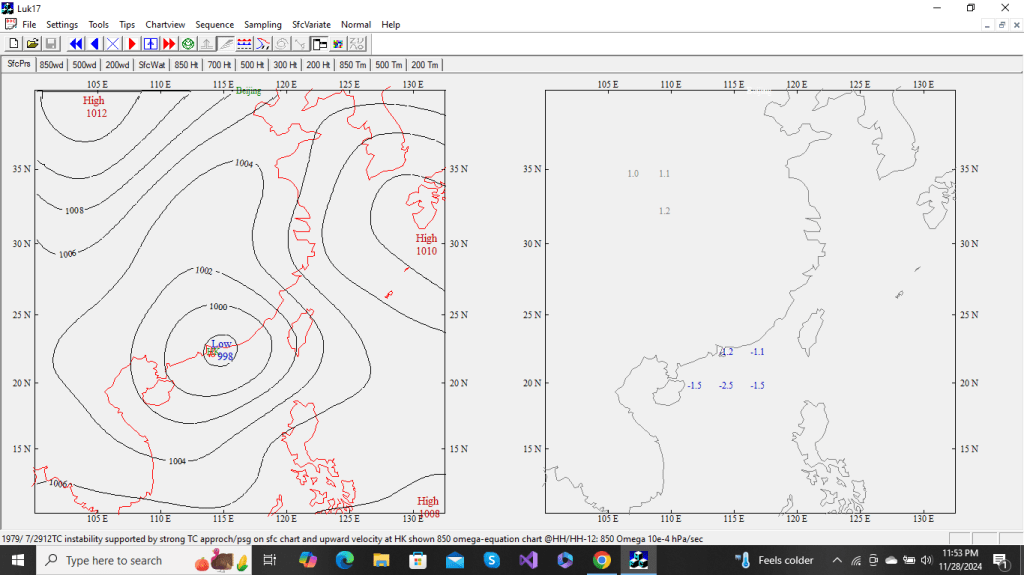
Under 5 occasions, tropical cyclone (of any intensity even low-pressure area applies) close or direct impact to HK, rainstorms with no sign in behavior can occur in summer when it can be detected that on the omega (vertical velocity) chart HK is experiencing upward (negative) vertical velocity, forming the second virtual behavior.
Chart 1 79072912 At 200 hPa despite a large anticyclone to northeast rapidly weakens, no behavior can be observed (the ridge extension from NE is not accepted since it does not make an impact on north row)
79072912
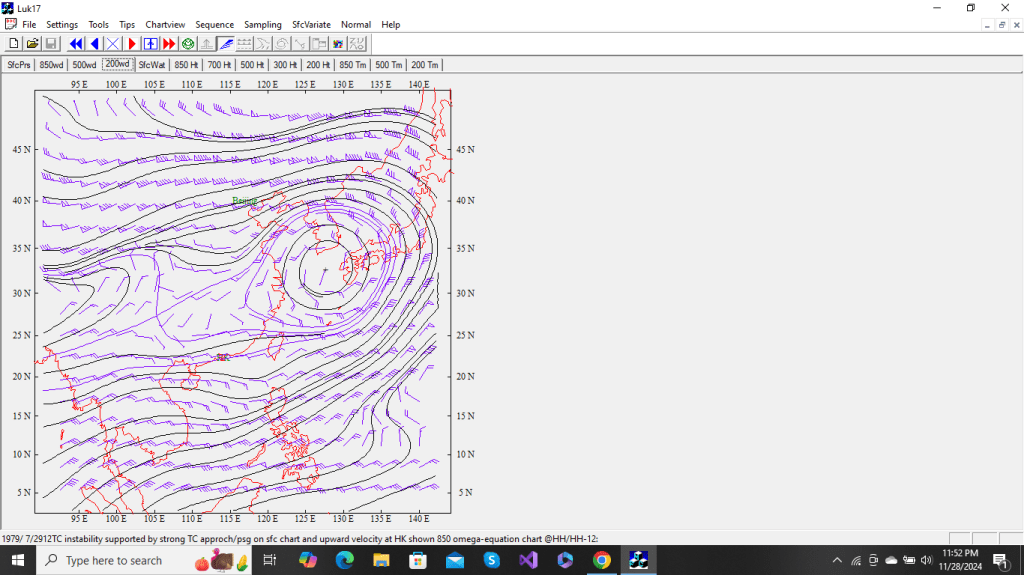
Chart 2 79072912 In the actual 850 hPa at hour+0 omega activity can be observed at HK.
As a word of caution, virtual behavior is neither necessary nor sufficient for general heavy rainstorm detection. Virtual behavior works as a sufficient condition where no real behavior can be found. According to situation Example 3 in the VERIFICATION Section below, virtual behavior only works in heavy rainfall cases only four times in the past. Each time it occurred only in July or August, only for tropical cyclones of equal to or higher than Severe Tropical Storm intensity, and got to be close to a moment of direct impact to HK.
CONCLUSION
After viewing all example cases, the last question is could there be any historical heavy rainfall case where no behavior (neither real nor virtual) was found. The answer is yes. From the very beginning, we have sampled each atmospheric condition at 200 hPa level on a 12-hourly time slice. There are 6 cases when perturbations are either coming late (i.e. fell within the next time slice) or seemingly too far away from Hong Kong to post any threat.
The foregoing discussion has focused on what, where and how to identify behavior from various atmospheric meteorological features on the streamline charts for the practice in weather disturbance detection. The next step is to make a strategic plan to apply this knowledge. First, each behavior-bearing meteorological feature confines its activity to a specific period of each year, so we can narrow down the list of observations from each category to those which can happen in the current season. Secondly, we should focus our attention on looking for such features’ form (shape), location (where) or activity (how) according to each category’s characteristics or attribute. Lastly, the search in behavior from features of category 3 (basically consisting of the westerly trough and large anticyclone) requires some elaboration concerning 1) features’ seasonal occurrence, geographic location, 2)westerly trough’s formation, degeneration, retrogression or pa7ssage, and 3) anticyclone’s extension, expansion or intrusion, and its interaction with westerly trough situated at close or remote distance.
VERIFICATION
This study only deals with cases in which occurrence of behavior types are associated with historical rainstorms without addressing occurrence of the same behavior type without rainstorm. Thus it is interesting to find out how well the association performs in real life.
The first step is applying a preliminary detection from behavior occurrence in the outside-sample period. The results show, under three different situations, unreasonably high occurrence frequency for certain behavior types is observed compared with those of the inside-sample period.
Situation example 1 (unprecise type definition too easily matched): treat anti-cyclonic cell nearby HK as behavior. Such a definition is not correct because rain-bearing anti-cyclonic cell is not just any cell. We need elaboration to get into the full details about which type of cell. In reality, only a handful of the numerous anti-cyclonic cells occurring at certain particular locations or with side conditions could qualify behavior in those cells. A typical case on such cell follows:
30.5mm (109.1mm) 82080100
Situation example 2 (secondary instead of primary behavior type selection): row ridge shrinking, axis angle-sharpening or small compact high-cell happening on own row near HK is always the ready pick in behavior type for heavy rainfall occurrence. This behavior is a by-product of more specific (most probably stronger) behavior types. For example, the specific behavior which states ‘HK is at the inflection point between a horizontal trough north of HK and a sharp ridge near HK on own row’ is always a better alternative. Under such circumstances, we were right (that behavior did occur) for a wrong (that of using secondary behavior) reason.
Situation example 3 (indiscriminate assignment to some nonheavy rain situation): in the absence of real behavior, virtual behavior type 2 with low-pressure circulations existing near HK is the accepted behavior. The truth is, virtual behavior applies in heavy rainfall cases only four times in the past. Each time it occurred only in July or August, only for tropical cyclones of equal to or higher than Severe Tropical Storm intensity, and got to be close to a moment of direct impact to HK.
After applying screening for fixing the above-mentioned undesirable cases on preliminary detection, the result is now ready for verification on the background rainfall data. Disturbance detection at 200 hPa is assisted by observation on the water vapor content chart, 850 hPa streamline analysis chart, surface pressure chart and VC++ program generated 850 hPa omega equation chart. (In-house software program is adapted to run on NCAR grid products for any geographical region on earth.)
After applying disturbance detection on 200 hPa streamline charts for the 9-year outside-sample(2013-2021) period without knowing any background rainfall information throughout the process, three main types of errors are identified. The reasons for how each type occurs and the method of reducing it in future are described as follows.
- Mis-identification of non behavior:
The occurrences of a large number of screw-up cases are examined and found to be due to the following reasons: axis position through HK not close, upstream or downstream curvature not comply with inflection, significant ridge-shrinking or curvature-sharpening not present, and in-time curvature changing not observed. It could happen because of inexperience in differentiating between behavior and non-behavior situations since one’s experience is confined to looking at ‘actual’ behavior types only during the model development phase. In addition, misinterpretation can result from neglecting to ensure the presence of some essential features associated with certain behavior. For instance, in the formation of the easterly wave under the ridge to the north or east of HK, the existence of a strong ridge behind the easterly wave’s crest must be a precondition(refer to Category 1 Case 4a redefinition for detail). Similarly, for the passage of numerous mid or high-latitude troughs, only a handful of those troughs each with a strong ridge ahead of the trough’s southeast side can qualify(refer to Category 3 Case 4 redefinition for detail). - Storm of moderate magnitude or ‘weak-parity’ error:
Twelve (12) cases are associated with 12-hourly rainfall of 30 to 49.9 mm.
Eleven (11) cases are associated with 12-hourly rainfall of 50 to 79.9 mm.
There is no clear-cut way to assess the intensity of behavior types appearing before a storm based on direct observation. Hence storms not reaching the threshold intensity could occur. Furthermore, most storms lasting over 2 periods often only sustain the threshold intensity in one of the periods even though associated behavior development is observed and prevails in both periods. Under such circumstances, the period with weaker intensity would end up in a ‘weak-parity’ error. With period rainfall in the 30 to 49.9 mm range, the number of moderate magnitude errors is 9 and the number of weak-parity errors in pre-storm(first) and post-storm(second) periods are 1 and 2 respectively. With period rainfall in the 50 to 79.9 mm range, the number of moderate magnitude errors is 5 and the number of weak-parity errors in pre-storm(first) and post-storm(second) periods are 2 and 4 respectively. - Missing in detection error:
Out of the 38 heavy rainstorms, only 5 cases have their behavior types get identified.
It is a major setback as the theme of this study is on capturing occurrences of extreme rainfall through disturbance detection. One possible explanation for the discouraging performance result might be attributable to trying to verify all cases in one batch without checking, after each detection case, against the rainfall outcome for an explanation of success or failure, but delaying the checking to the end of all detections. In so doing, one cannot learn through the process and gather experience as one moves along. Hence if one performs all detection jobs without immediate validation on each outcome but leaves it until the end, one’s detection experience could be equivalent to staying that of a beginner. Most behavior types have a certain degree of recurring capability in time. If, on the other hand, the result for each date-time checked out is promptly validated, it could contribute useful information towards the successful identification of similar case/s at a later date. - *Based on the new approach, the verification exercise is re-conducted and the statistics on the 12-hourly rainstorms>= 80mm case are composed as follows:
Detection fails in 3 cases of misinterpretation.
Detection fails 15 cases of unfamiliar or new variation within type making it difficult to identify.
Detection succeeds in 8 cases.
Detection succeeds in 12 cases inspired by similar types (mostly of unfamiliar or new variations) which occur earlier in the historical sequence. - *Remarks: verification of the model was carried out in 2021 when it was at an early stage of development. The performance statistics of the model obtained may not reflect the model’s capability level as the up-to-date model now reaches and hence may be ignored.
To illustrate the difficulty in identifying the occurrence of unfamiliar or new variation within type, 3 examples from the verification period, and 1 example( Example 4) from within sample period, are presented as follows:
Example one 93.3mm – 16093012(from verification period)


Example two 101.2mm – 21062800(from verification period)

Example three: in the outside-sample period, all (2) perturbations developed within the deep zonal westerlies over the entire region, but in the sample period, all (4) perturbations developed on the northern side of a ridge over Indo-China.
(non-heavy) (124.9mm) 14050812(from verification period)
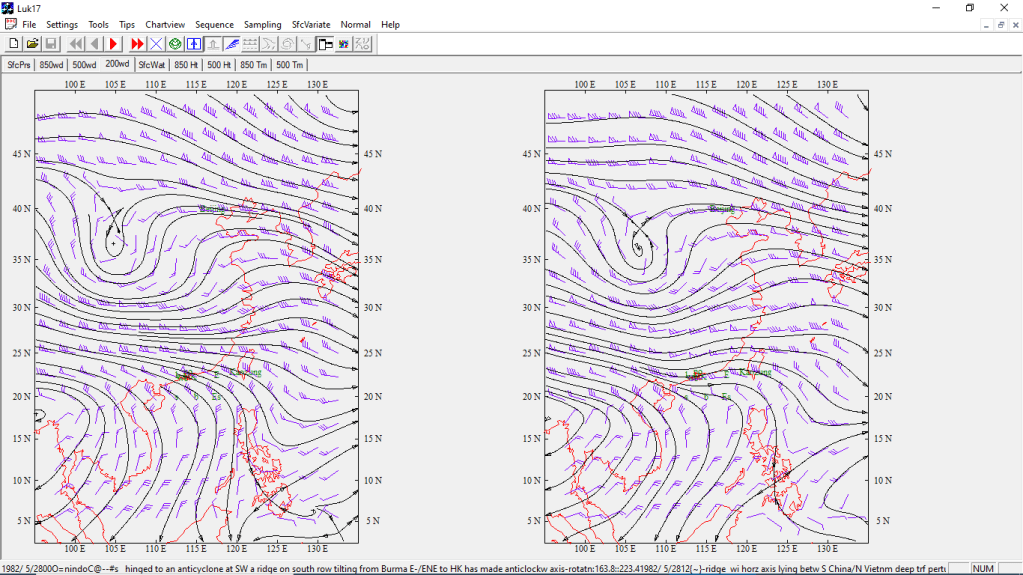
C
ompare to the within sample period case next(163.8mm)(spell case) (223.4mm) 82052812(model development period)
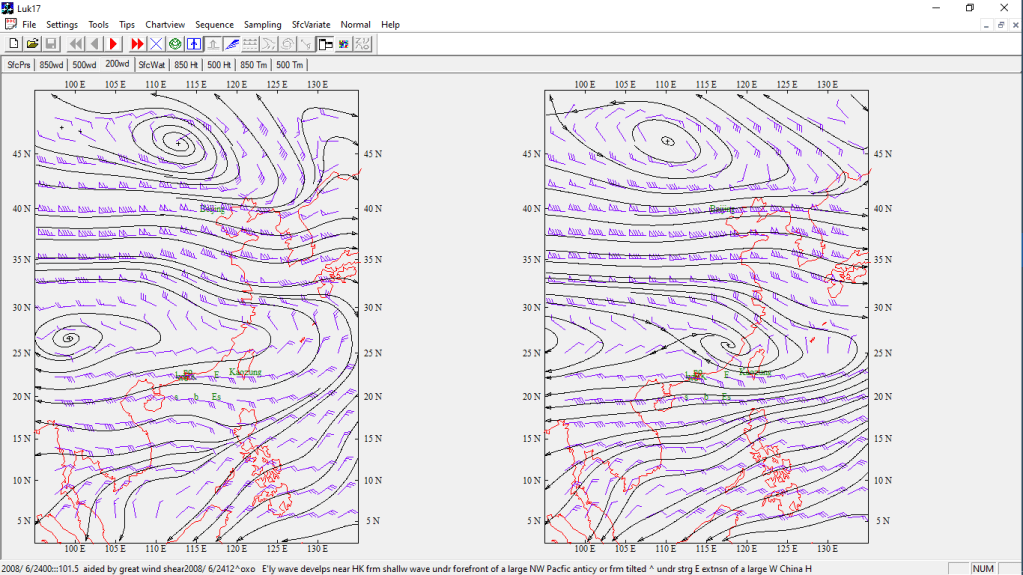
Example 4: 101.5mm – 08062412(variation within type from development period)
It is interesting to note that there is no new behavior type appearing during the verification data period suggesting that the set of existing behavior types is self-contained. The set of behavior types is composed of 47 types, 3 of which are unique in record of occurrence.
CLOSING (standalone Anticyclone)
First Case: Anticyclone centered West of HK at 27N intensifies/expands eastern extension over southeast China resulting zonal flow reorientation from east-northeasterly to easterly at the South China Coast. (comparable to Case 3.3b’s right hand side chart which shows a skew asymmetric expansion on the far eastern side of the anticyclone thus resulting an easterly wave like zonal bending feature)
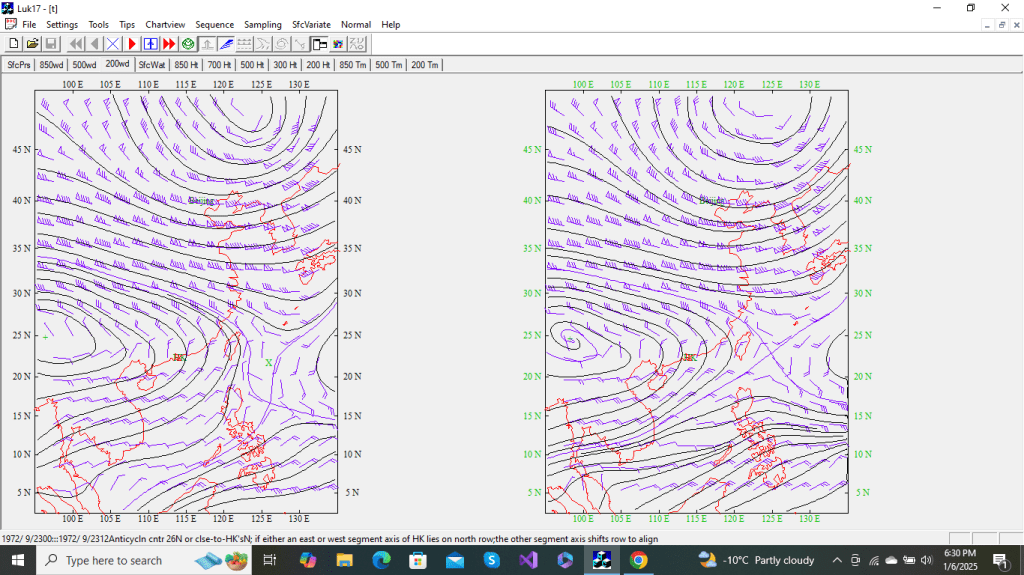
Second case (2 examples):
Anticyclone centered West of HK between 25 and 27N intensifies on base expansion and extends or sharpens-axis towards Hong Kong with/without clockwise/anticlockwise- axis rotation.


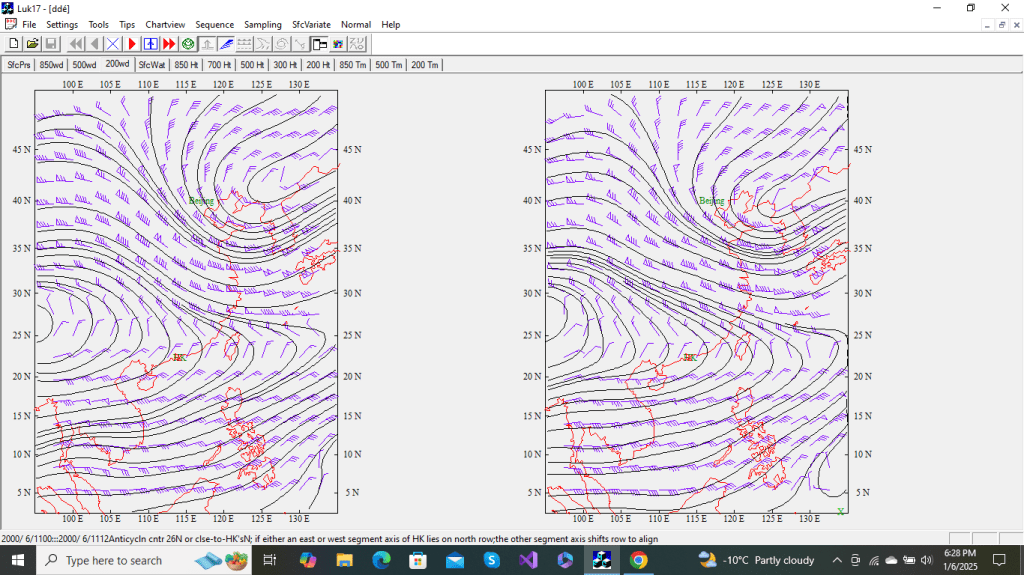
Third case
Anticyclone centered at 26N or close to HK’s north, if either the east or the west segment axis of HK lies on the north row, segment axis on the other side can shift north or south to align.
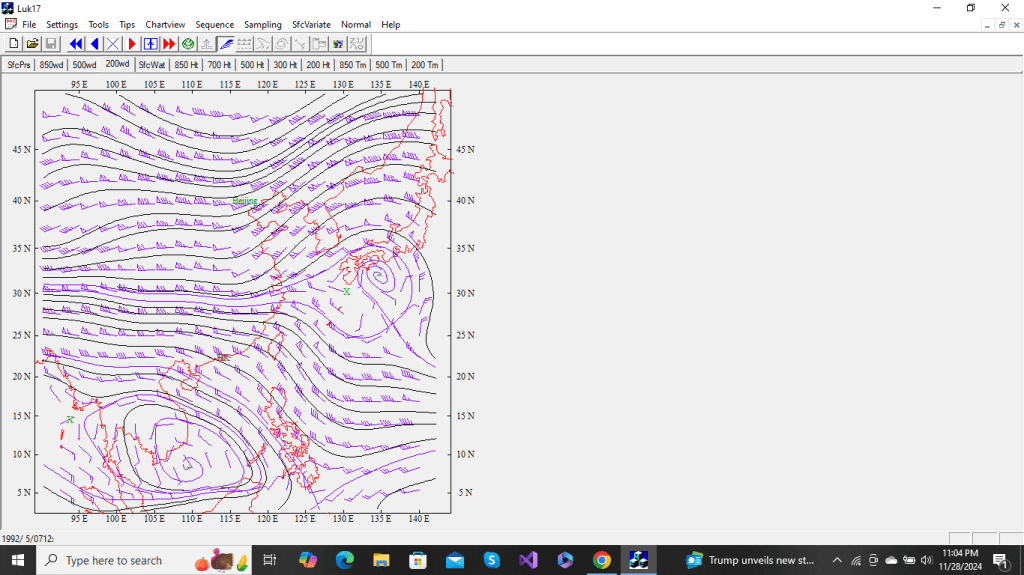
In contrast to the forgoing standalone behavior types comes the most dramatic interactive behavior type ever occurred. Due to the complexity of the synoptic feature, its type definition could not be successfully composed until a clue on its aftermath chart(shown below) caught my attention at the very late project development stage. Hence this is also the most challenging case: 126.7mm – 74082300
previous 12-hour: 1.6 mm (00-06Z) (126.7 mm)74082300

A trough, which was formed by massive shrinking on a West China anticyclone’s east extension ridge with its tip near Southeast China coast, was making passage towards the east. The next chart shows drastic anticyclonic expansion over Southeast China.
aftermath Chart:

In comparison with the same behavior on trough formation with extension ridge shrinking, refer to Cat 3 Case 4 (first case in the spell) :


Acknowledgement
I wish to dedicate this thesis to Mr. Peter Peterson for his initiation in the study of 850hPa convergence using the Bellamy Triangle. I would also like to dedicate it in memory of Mr. Ho-Chong Leong for his asking me to share my rudimentary work with other peers in the office, and to Mr. Wing-Cheong Poon for responding to the sharing with the enlightening idea of using 200hPa divergence. Together they paved the way for my study of 200hPa vorticity, which disturbance detection is all about.
Appendix
Charles Luk (retired weather researcher, meteorological graphic chart specialist, meteorological Database manager)
Software development
Data source: NCAR Dataset- for availability, try to cite this URL data link on the Web page, https://rda.ucar.edu/datasets/ds090.0/#!description. After data from NCAR is downloaded into a disk folder for each year in the dataset containing a single subfolder A00Z12Z, you can run(execute) the “In-house executable” of this Study Project to create a database file NMCData and transfer data from the yearly subfolder A00Z12Z onto NMCData. The data format is compressed before storing onto disk and decompressed when retrieved for processing.
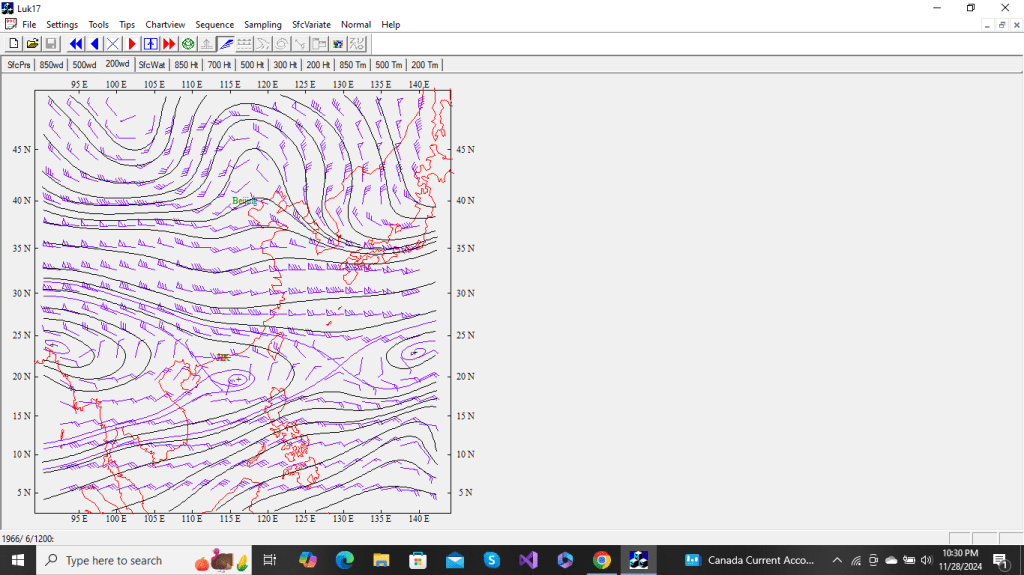
The In-house Microsoft Visual C++ software program can run on any Windows platform. It is very user-friendly and with online-tip buttons on the toolbar at the top of the screen. It can be used by any country(with a slight change in the Visual C++ pre-compiler and minor program code modification) to fit the domain defined in any geographical region or location on earth. Specific chart areas can be outlined and assigned to individual weather cities(stations) within the country for display with coastlines on polar-stereographic(refer to example shown in the last case in the CLOSING paragraph) or Mercator projection.
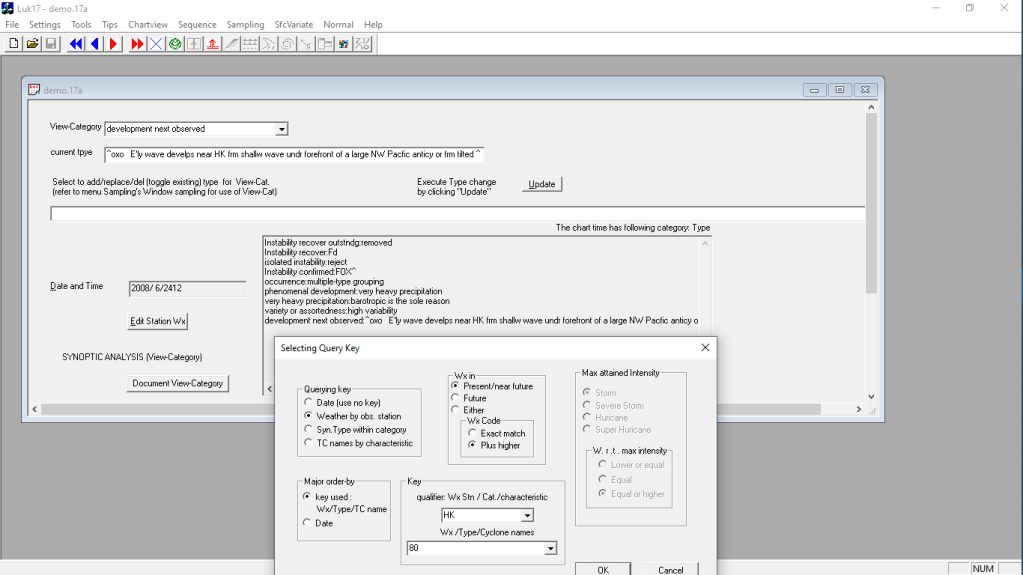
NMCData contains all the 2&1/2-latitude-longitude degree grid point analyses of u/v components and contour/isobar values at standard pressure levels. Data retrieval is done by a sampling scheme on a screen dialogue (refer to the diagram below). The detailed sampling scheme works as follows:
- Weather station(city) names and synoptic hour weather can be input(with automatic progress tracking). Standard present weather code symbols are program-defined for plotting(optionally) occurrence at each weather statioin on all surface pressure chart displays. A list of the synoptic datetime, at which specific weather occurred to a weather station, can be retrieved from a dialogue box to form a primary display sequence. Each record in the primary sequence can be selected from its dropdown list to include its earlier and/or later records on a secondary sequence. Two secondary chart sequences can displayed side-by-side for comparison. The simplest way to form a secondary sequence (with one preceding and one succeeding datetime records) around every primary record, is by setting(toggle) an ‘instability button’ on the toolbar.
- Tropical cyclone(TC) names and tracks of 6-hourly positions can be input. All surface charts can display TC tracks within the chart boundary with a maximum of 5 tracks in different colours. The latest 6-hourly direction and speed are program-generated and plotted. A list of charts’ date-times, when any historical tropical cyclone occurred, can be retrieved on the sampling screen by specifying its intensity or track classification as keys.
- Climatological normal or period mean charts can be produced and placed on screen for a side-by-side comparison.
Tracks of warm/cold front or occlusion input by mouse clicks on the surface chart screen can be stored and used for display on surface pressure charts.
However the most useful application for this program lies in the weather study on extreme rainstorm occurrences in Hong Kong. It is started by defining one or more(maximun unlimited) categories(meaning any subject of interest) and under each of which any number of types such as detailed occurrences or observations. Appropriate type within the category would be selected and assigned to the date-times(as a unit record) in the database . For example, 12-hourly rainfall can treated as category and under it intensities extreme, heavy, moderate, light or zero(default by not assigned) as types for assignment to any date-time record. Each master screen display shows the current record’s date time. Selections from the two edit boxes’s dropdowns can be assigned the current record’s category-type attribute. Once this is done, the same record can be retrieved from the database later at any time through a sampling process done on a specification dialogue box. For example, if radio button ‘synoptic type within category’ is clicked, the category ‘next development observed’ will show up in the dialogue box’s upper edit box’s dropdown, and various behavior types will appear in the lower edit box dropdown for selection to execute the relevant date-time record retrieval.
Preparations of the system software for the Microsoft Window Browser, which constitutes the most technical part of the whole application, are supported by a Visual C++ expert. He will be involved with the software modification and program build for each new user’s geographic location. Therefore the distribution of the program will be limited only to national weather offices, which can distribute to their branches in other cities.
Any interested organization may forward their request for a test version to my email. At the end of a test period which may last one or two months, they can decide to purchase the full version with a price depending on the Visual C++ software vendor, or no purchasing but pay a software modification fee and a program linkage fee for the test version otherwise.
